Loading...
No results

cTrader vs. MetaTrader: Key Differences and Similarities

Fusion Markets

post content image

In the fast-paced world of forex trading, having access to a reliable and efficient trading platform is paramount to your trading success. Among the titans of the forex trading platform world, two names stand out: cTrader and MetaTrader 4/5 (MT4 and MT5). These platforms have amassed an extensive user base and earned their loyal followings.


In this article, we'll delve into the intricacies of each platform, comparing their features, advantages, and limitations, to help you determine which platform is right for you.


Metatrader vs cTrader table of differences and similarities


Contents 


Genesis

User Interface and Customisation

Charting and Technical Analysis

Order Types and Placement

Algorithmic Trading and Expert Advisors

Mobile Trading


The Genesis of cTrader and MetaTrader


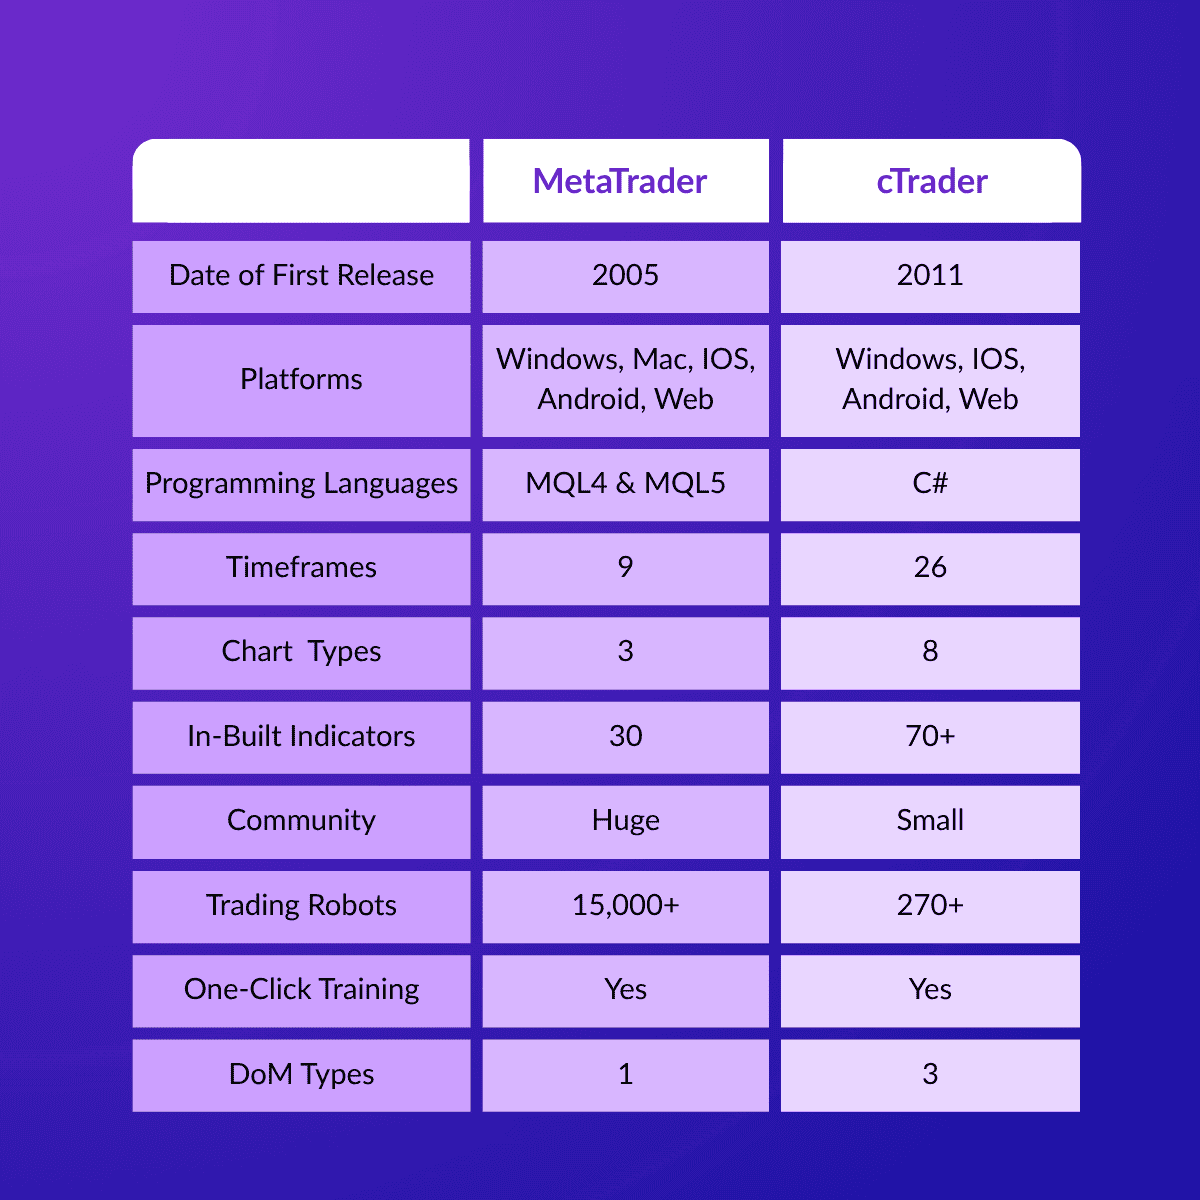
MetaTrader is the brainchild of MetaQuotes Software. The company introduced the first version, MetaTrader 4 (MT4), in 2005. Its successor, MetaTrader 5 (MT5), followed in 2010, bringing a host of new features and capabilities to the table.


cTrader was launched by Spotware Systems Ltd. in 2011, aiming to provide traders with a platform that offers a user-friendly interface and advanced functionalities. cTrader's main focus is on creating a seamless trading experience for both beginner and experienced traders alike.


User Interface and Customisation


One of the most significant factors in a trading platform's popularity is its user interface (UI). Despite MT4 being somewhat outdated compared to cTrader's modern design, both offer clean and intuitive interfaces, making them relatively easy for traders to navigate. However, they have different approaches when it comes to customisation.


cTrader takes the lead in UI customisation, allowing traders to personalise their workspace extensively. Users can arrange and resize various windows, add or remove trading indicators, and set up multiple charts on a single screen. This level of flexibility empowers traders to create an environment tailored to their specific trading needs.


On the other hand, MetaTrader, especially MT4, has a more rigid UI, with limited customisation options. While MT5 improved in this aspect, it still lags behind cTrader's superior customisation features. 


Charting and Technical Analysis


In terms of charting and technical analysis, both platforms deliver robust solutions. Traders can access a wide range of chart types, timeframes, and drawing tools on both cTrader and MetaTrader.


cTrader stands out with its intuitive charting package, providing more than 70 pre-installed indicators and a smooth drawing experience. It also offers Level II pricing data with its 3 depth of market (DoM) types (Standard, Price, VWAP), giving traders a greater insight into market depth and liquidity.


MetaTrader, however, remains a popular choice for technical analysis enthusiasts, thanks to its massive library of third-party indicators and analytical tools. This vibrant community-driven ecosystem ensures that traders have access to an extensive arsenal of tools to refine their strategies.


Let's dive into the specifics:


MetaTrader 4


Chart Types: MetaTrader 4 supports three fundamental chart types, namely Bar, Line, and Candlestick.

Timeframes: Nine distinct timeframes, spanning from 1 minute to 1 month.

Analytical Objects: 24 analytical objects, including lines, channels, shapes, arrows, and essential Gann and Fibonacci tools.

Technical Indicators: 30 built-in technical indicators. Furthermore, traders can explore over 2,000 free custom indicators and access 700 premium indicators available in the Code Base.

Chart Views: The platform allows traders to open an unlimited number of charts simultaneously. Moreover, traders can personalize their charts by creating templates that define specific attributes such as color schemes, chart types, scales, line studies, and applied indicators.


cTrader


Chart Types: cTrader comes with 8 chart types, but also includes additional variations such as tick and pip charts. These chart types include Bar, Line, Candlestick, Heikin-Ashi, HLC, Dot, Tick (configurable with 27 settings), Renko (with 19 settings), and Range-based charts (with 22 settings).

Timeframes: cTrader features 26 timeframes with the standard chart and over 50 timeframes and six zoom levels across all chart types (including tick and pip charts).

Analytical Objects: The platform boasts 33 analytical objects. 

Technical Indicators: cTrader offers 70 built-in technical indicators.

Chart Views: cTrader introduces Chart Views, allowing traders to detach charts and use them as separate tradable desktop applications across multiple screens. Additionally, ChartShot enables traders to share trading examples and strategies relatively easily.


Order Types and Placement


Now that we've got a comprehensive view of the differences in charting, let's delve into the nuances of order placement in MetaTrader and cTrader, highlighting their distinct approaches and functionalities:


Order Placement in cTrader


  • Weekend Order Placement: Traders using cTrader have the unique advantage of placing waiting orders during weekends, even when the markets are closed. This feature facilitates meticulous planning and analysis, allowing traders to prepare for the trading week ahead.

  • Specialized Order Types: cTrader goes a step further by introducing specialized order types like Buy or Sell Limit, adding an additional layer of risk management and trading versatility to the platform.

  • Click-and-Drag: Waiting orders, such as Buy Limit or Sell Stop, can be placed by selecting the order type and adjusting its position through an intuitive click-and-drag action directly on the chart.

  • Specialised Stop-Out features: Smart Stop-Out (partial closure while retaining entry) and Fair Stop-Out (full closure to maximize margin for active positions) give traders better risk management tools.


Order Placement in MetaTrader


  • Traditional Approach: MetaTrader employs traditional methods for order placement, necessitating traders to click directly on the desired spot in the chart to execute waiting orders.

  • Limited Specialized Order Types: MetaTrader has all the necessary order types needed for trading but lacks some of the more advanced features like cTrader's smart stop out.


Algorithmic Trading and Expert Advisors


The next significant aspect we need to consider is automated trading. In MetaTrader applications, both MT4 and MT5, traders can utilise Expert Advisors (EAs), which are manually coded programs designed for automated tasks, such as technical analysis of price data and executing positions on specific instruments.


When comparing MT4 to MT5, the primary difference between their Expert Advisors lies in the programming language they employ. Since MQL4 has been in use for a longer time than MQL5, there is a more extensive collection of pre-written scripts and codes available for traders to create their personal Expert Advisors, even if they lack programming knowledge. On the other hand, MQL5 is a simpler programming language, making it easier for traders to create new scripts themselves.


Regarding cTrader, it also offers similar programs known as cBots, which function similarly to Expert Advisors. As mentioned earlier, cTrader uses the widely recognised C# programming language, theoretically making it the most versatile among the three languages (MQL4, MQL5, and C#) with a larger consumer base. 


However, in reality, cBots are less popular than Expert Advisors (EAs), and the reason for this is that the online trading community supporting EAs is much larger than that of cBots. Consequently, there are more pre-existing templates available for MT4/MT5 compared to cTrader. 


Mobile Trading


Mobile trading has become an integral part of the modern trading experience. Both platforms offer mobile applications for iOS and Android devices, enabling traders to stay connected to the markets on the go.


cTrader's mobile app is widely acclaimed for its user-friendly design and seamless functionality. It provides real-time quotes, interactive charts, and order execution capabilities, giving traders full control over their portfolios from the palm of their hand.


MetaTrader's mobile app, too, is highly regarded and offers a range of features for on-the-go trading. It allows traders to access their accounts, execute trades, and monitor markets in real time.


Conclusion


In conclusion, both cTrader and MetaTrader are powerful trading platforms, each with its own set of unique features and strengths. cTrader shines in its user-friendly interface, extensive customisation options, and array of features. On the other hand, MetaTrader's widespread popularity gives traders a great pool of resources to draw on and stronger community support, while having all the tools needed to be successful in the markets.


Ultimately, the choice between cTrader and MetaTrader depends on individual preferences, trading styles, and specific needs. Traders should consider their asset preferences, technical analysis requirements, and whether they prefer a larger community-driven ecosystem or a more user-friendly interface with more features. Regardless of the choice, both platforms have significantly contributed to enhancing the trading experience for millions of traders worldwide.


Ready to Start Trading?


  1. Sign Up for Fusion Markets, Australia's Lowest Cost Forex Provider*

  2. Create Your cTrader or MetaTrader 4 or 5 Account.

  3. Download Your Preferred Version of cTrader (Desktop, Mobile - iOS and Android), MetaTrader 4 (Desktop, Mobile - iOS and Android) or MetaTrader 5.
    Or
    Trade With Your Browser with cTrader WebTrader, MetaTrader 4 WebTrader or MetaTrader 5 WebTrader.

  4. Fund Your Account

  5. Start Trading!


We’ll never share your email with third-parties. Opt-out anytime.

Relevant articles

Trading and Brokerage
post image main
Index CFD Dividends | Week 16/09/2024
Fusion Markets

Please see the table below for any upcoming dividend adjustments on indices for the week starting September 16th, 2024.


undefined

* Please note these figures are quoted in the index point amount


What is a dividend?


Dividends are a portion of company earnings given to shareholders. As indices are often composed of individual shares, an index dividend pays out based on individual shares proportional to the index’s weighting.


Trading on a CFD Index does not create any ownership of the underlying stocks, or an entitlement to receive the actual dividends from these companies.


What is an ex-dividend date?


An ex-dividend date is the cut-off date a share must be owned in order to receive a dividend. If an investor buys a share after the ex-dividend date, then they will not be entitled to earn or pay the next round of dividends. This is usually one business day before the dividend.


Do dividends affect my position?


Share prices should theoretically fall by the amount of the dividend. If the company has paid the dividend with cash, then there is less cash on the balance sheet, so in theory, the company should be valued lower (by the amount of the dividend).


Due to the corresponding price movement of the stock index when the ex-dividend date is reached, Fusion must provide a 'dividend' adjustment to ensure that no trader is positively or negatively impacted by the ex-dividend event.


How will the dividend appear on my account?


The dividend will appear as a cash adjustment on your account. If your base currency is different from the currency the dividend is paid out in, then it will be converted at the live FX rate to your base currency.


Why was I charged a dividend?


Depending on your position, given you are holding your position before the ex-dividend date, you will either be paid or charged the amount based on the dividend. Traders shorting an index will pay the dividend, whereas traders who are long the index will be paid the dividend.


Why didn’t I receive my dividend?


You may not have received a dividend for a number of reasons:


- You entered your position after the ex-dividend date

- You are trading an index without dividend payments

- You are short an index


If you believe the reasons above do not apply to your position, please reach out to our support team at [email protected] and we’ll investigate further for you.


Forex Trading
CFD
Dividends
16.09.2024
Trading and Brokerage
post image main
The Real Cost of Forex Trading
Fusion Markets
Understanding the characteristics of the forex market is crucial for success. The concept is simple; forex trading involves buying and selling currencies with the aim of making a profit. However, many new traders dive into this market without fully grasping the real costs involved. In this guide, we'll explore the hidden expenses that can impact your trading profitability and provide tips to incorporate into your trading and avoid any unnecessary costs.


Understanding the Hidden Costs


Spread and Commissions


When trading forex, you'll encounter bid and ask prices. The bid price is what buyers are willing to pay, while the ask price is what sellers are asking for. The difference between these two prices is known as the spread. This spread represents the cost of trading and can vary depending on market conditions and the broker you're using. Additionally, account types such as Fusion Markets’ Zero account, don’t have a spread, but rather commissions on each trade. This can be beneficial to traders who are looking for a regular-cost solution.


Understanding the impact of spread on trading costs is essential. Even seemingly small spreads can add up over time, affecting your profitability. Different brokers offer various commission structures, including fixed or variable spreads and commission-based pricing. It's crucial to compare these structures and choose the one that aligns with your trading strategy.


Overnight Financing Fees


When holding positions overnight, you may incur overnight financing fees, also known as swap rates. These fees are charged for the privilege of keeping a position open beyond the trading day. Calculated based on the interest rate differential between the two currencies being traded, overnight financing fees can eat into your profits over time. Long-term traders should carefully consider these fees as they can significantly impact overall profitability if you’re holding a position with a negative swap for multiple days or weeks.


Slippage


Slippage occurs when the execution of a trade differs from the expected price. It can be caused by market volatility, liquidity issues, or delays in order execution. Slippage can lead to unexpected losses or reduced profits, especially during fast-moving markets or when trading large positions.


To minimise slippage, traders can use limit orders, advanced trading algorithms, or avoid trading during periods of high volatility, such as major news releases or the day rollover.


Tools for Transparent Financial Analysis


Fusion Markets Spreads Tool


Trading Journal


Keeping a detailed trading journal is essential for tracking your performance and identifying areas for improvement. Your journal should include details such as entry and exit points, trade duration, position size, and reasons for entering the trade. Analysing this data can help you identify patterns in your performance, enabling you to refine your strategy, and optimise your trading approach.


Performance Metrics


Key performance metrics such as win rate, risk-reward ratio, and drawdown are valuable tools for evaluating your trading performance. A high win rate alone does not necessarily indicate success if the risk-reward ratio is unfavourable or if drawdowns are excessive. By calculating and interpreting these metrics, you can gain insights into the effectiveness of your trading strategy and make adjustments accordingly.


For example, a trader might have a win rate of 70% but still not be profitable. By analysing their performance metrics, the trader can identify that they have an inadequate risk-reward ratio; meaning that their losing trades are, on average, larger in value than their winning trades.


Historical Data Analysis


By leveraging past market movements and trends, traders gain valuable insights for informed decision-making. Whether assessing the viability of a trading strategy or gauging potential risks, historical data provides a rich tapestry of information.


Using historical data, traders can back-test strategies. Back-testing involves testing a trading strategy using historical data to see how it would have performed under past market conditions.


By incorporating historical data into risk management practices, a trader can better anticipate potential risks and adjust their strategies accordingly.


In the ever-changing world of trading, historical data becomes like a guiding light, preparing us for what could happen, based on previous events. In turn, this knowledge allows traders to make more informed decisions. You can view Fusion’s Live and Historical spreads to stay informed.


Tips for Transparent Financial Analysis


undefined


Set Realistic Profit Expectations


It's essential to set realistic profit expectations based on your trading strategy and risk tolerance. Avoid overestimating potential profits and understand the relationship between risk and reward. Remember that trading involves inherent risks, and losses are inevitable.


Practice Risk Management


Implementing proper risk management techniques is crucial for preserving your capital and long-term success. This includes setting stop-loss orders to limit potential losses and employing position sizing strategies to manage risk exposure effectively.


Managing open trades by tightening your stop as the derivative moves in your intended direction can also boost your R-multiple and improve your return over the long-run.


Continuously Educate Yourself


The forex market is dynamic and constantly evolving, so staying up to date on market trends and developments is essential. Continuously educate yourself through books, online courses, and seminars to refine your skills and stay ahead of the curve.


Choosing Reputable Brokers with Transparent Fee Structures


Selecting a reputable broker with transparent fee structures is paramount. Before committing to a broker, thoroughly research their reputation, regulatory compliance, and fee structures. Don't hesitate to ask questions and seek clarification on costs to ensure transparency and avoid unexpected expenses. 


Conclusion


Navigating the hidden costs of forex trading requires a combination of knowledge, skill, and diligence. By understanding the various expenses involved, utilising tools for transparent financial analysis, and practising sound risk management, new traders can increase their chances of success in the forex market. Continuously educate yourself, choose reputable brokers, and always prioritise transparency in your trading endeavours.


If you want to know more about Fusion Markets, our products, fee structures and services, please contact a member of our friendly team or visit our live chat on our site. 

Forex
Trading
Tips
08.08.2024
Ready to Start Trading?
Get started live or get a free demo