How to Trade on TradingView
For those familiar with the trading landscape, you’re probably already well aware of TradingView. Founded in 2011 by brothers Stan and Constantin Bokov, this widely recognised platform was created with the aim of being an all-in-one platform for traders to connect, share ideas and learn from each other. Today, it is one of the most widely used trading sites on the internet - with over 50 million users worldwide.
Now, picture this: Trading on the advanced charts on TradingView at some of the lowest costs available on the market. Sounds exciting, doesn’t it? By connecting your TradingView account with your Fusion Markets account, you now can. At Fusion, our mission has always been about making trading accessible to everyone by offer radically low costs and no hidden fees or catches. That’s why we’ve partnered with TradingView to make low trading at the highest quality even more accessible.
This article will delve into what TradingView is, its key features, and a step-by-step guide on how to effectively trade on the platform.
Contents
Getting Started
Navigating the TradingView Interface
Trading on TradingView
Managing Positions and Live Trades on TradingView
TradingView Strategies
Conclusion
Getting Started
Before you dive into the world of trading on TradingView, you'll need to set up an account. Here's how to get started:
- Account Creation: go to tradingview.com and sign up for a free or paid account. The free version offers a wide range of features, while the subscription provides additional perks, such as more alerts, indicators, and the ability to use multiple charts.
- Personalising Your Profile: Customise your profile by adding a profile picture and filling out your bio. This can help you connect with other traders on the platform and share your insights.
- Selecting a Subscription: If you decide to upgrade, choose the plan that suits your needs best. You can compare the available plans on TradingView's website.
You will also need to create a Fusion Markets’ account or login to the existing one. If you struggle with selecting whether to sign up for a Classic or Zero account, visit our Accounts Overview page.
Once it is done, here’s what you have to do next:
- Go back to tradingview.com and open a chart that you want to start trading from.
- Click on ‘Trading Panel’ at the bottom and choose Fusion Markets;
- Select your account type and click on ‘Continue’;
- Log in using your Fusion Markets account;
- Tick the accounts that you wish to use and click on ‘Allow’ when finished.
You are all set!
Navigating the TradingView Interface
After setting up your account, the next step is to familiarise yourself with the TradingView platform. The platform is intuitive and straightforward to navigate, with a wide range of features and tools neatly organised for ease of use.
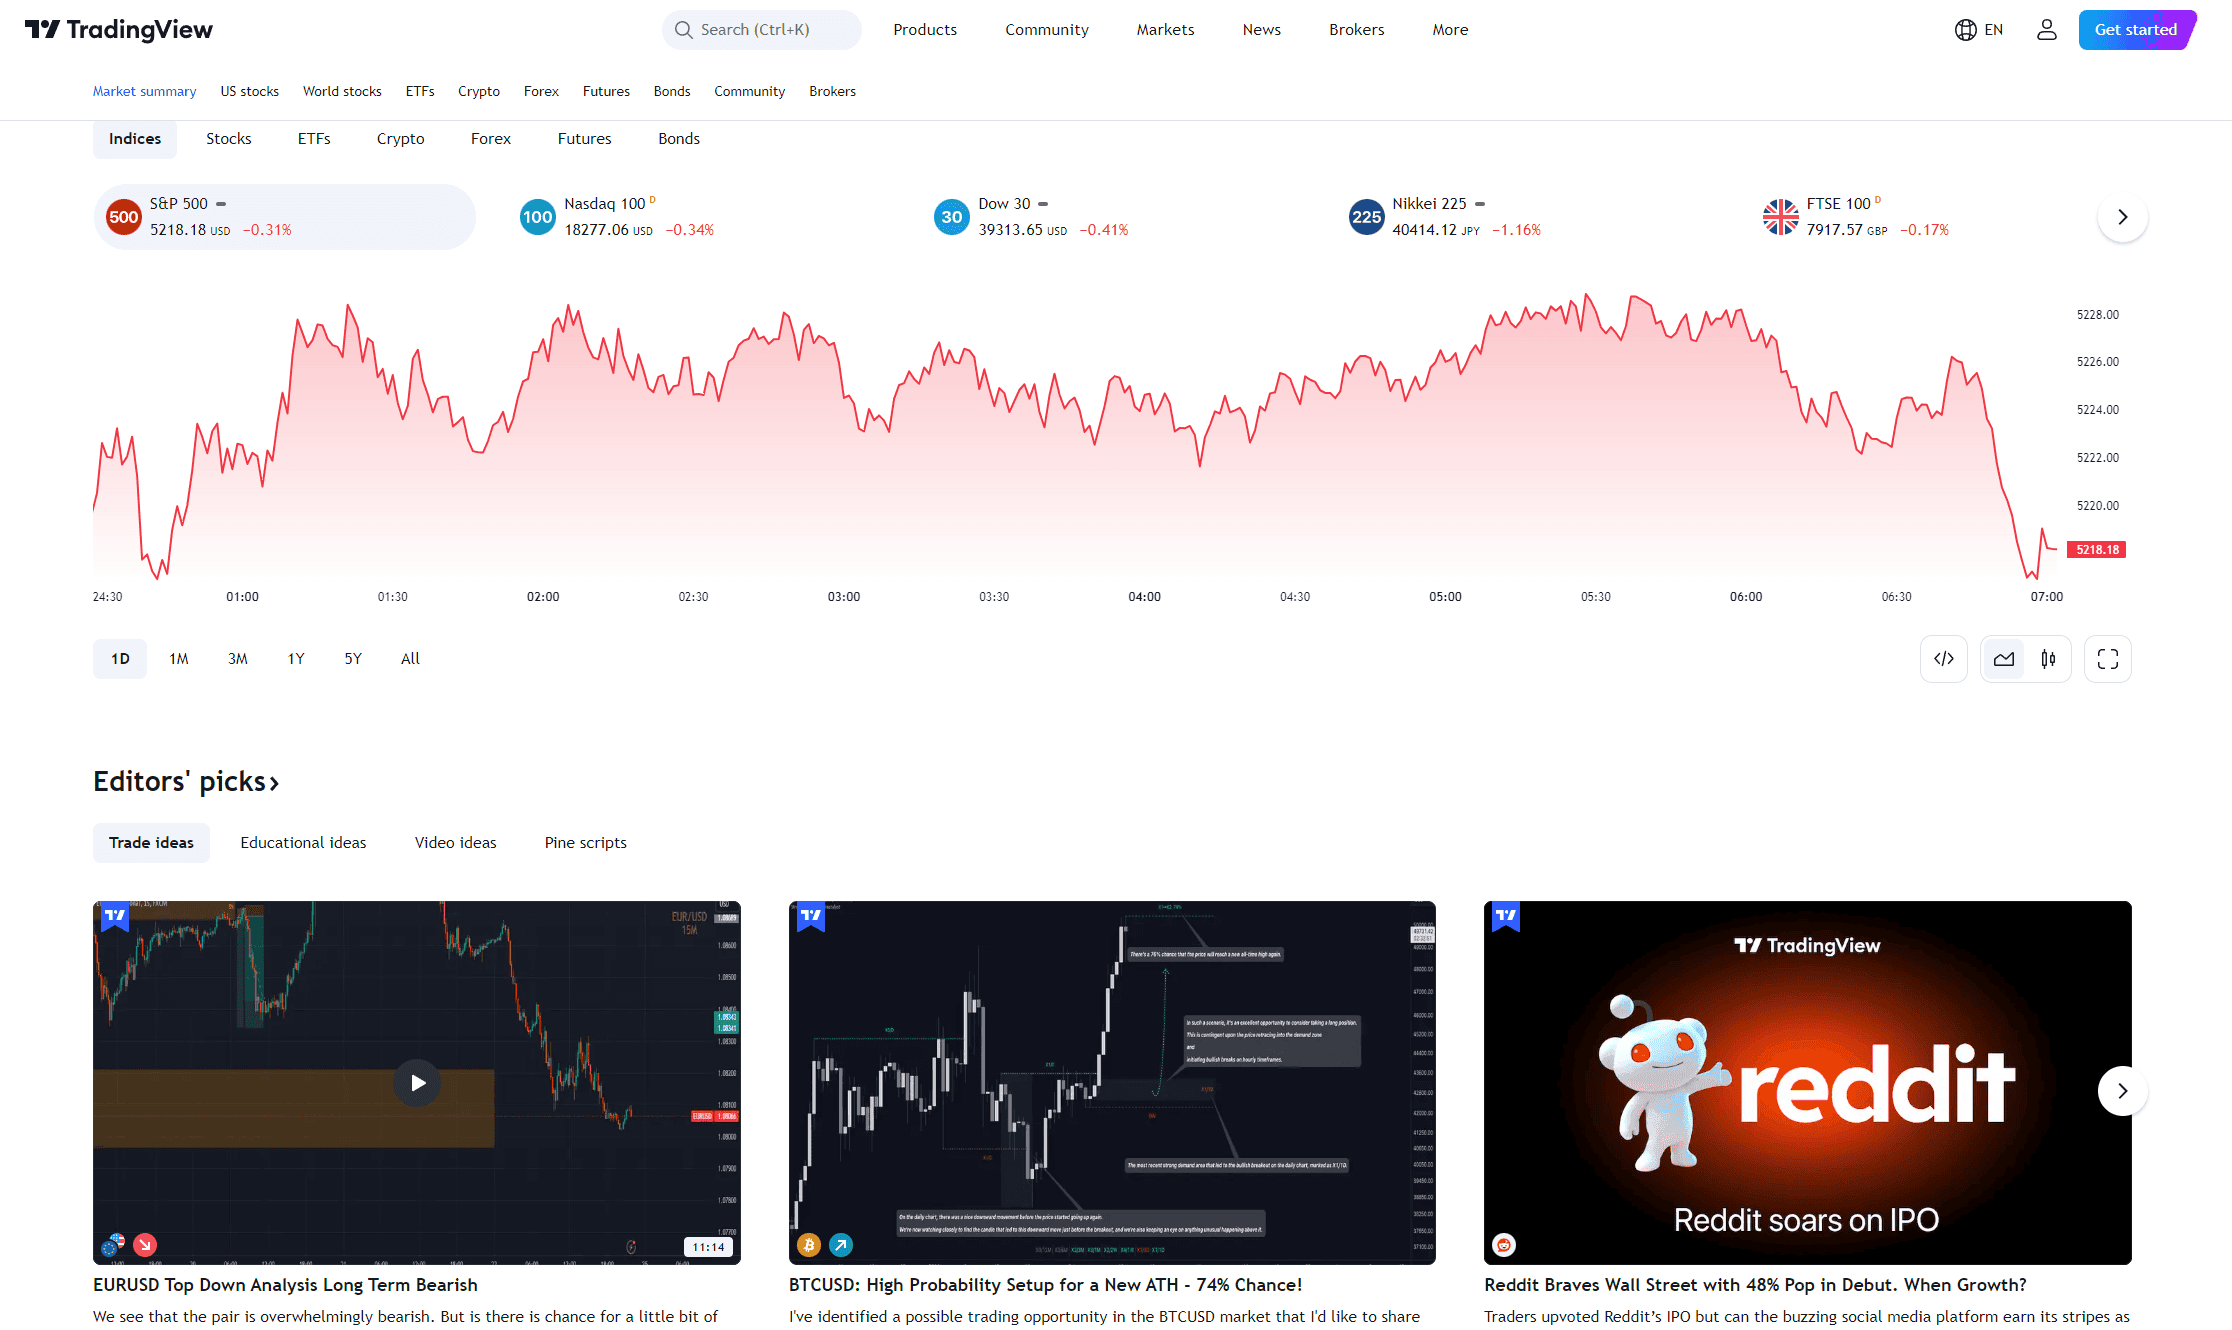
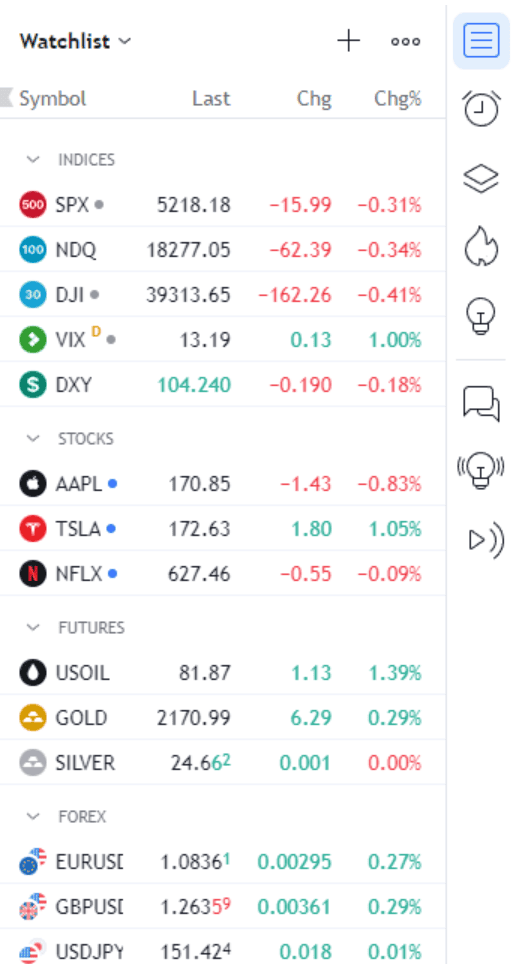
Homepage Overview: The homepage provides an overview of the financial markets. On the right-hand side, you'll find the news feed, watchlist, and trading panel.
You can customise it by adding watchlists and widgets for specific assets or markets you're interested in.
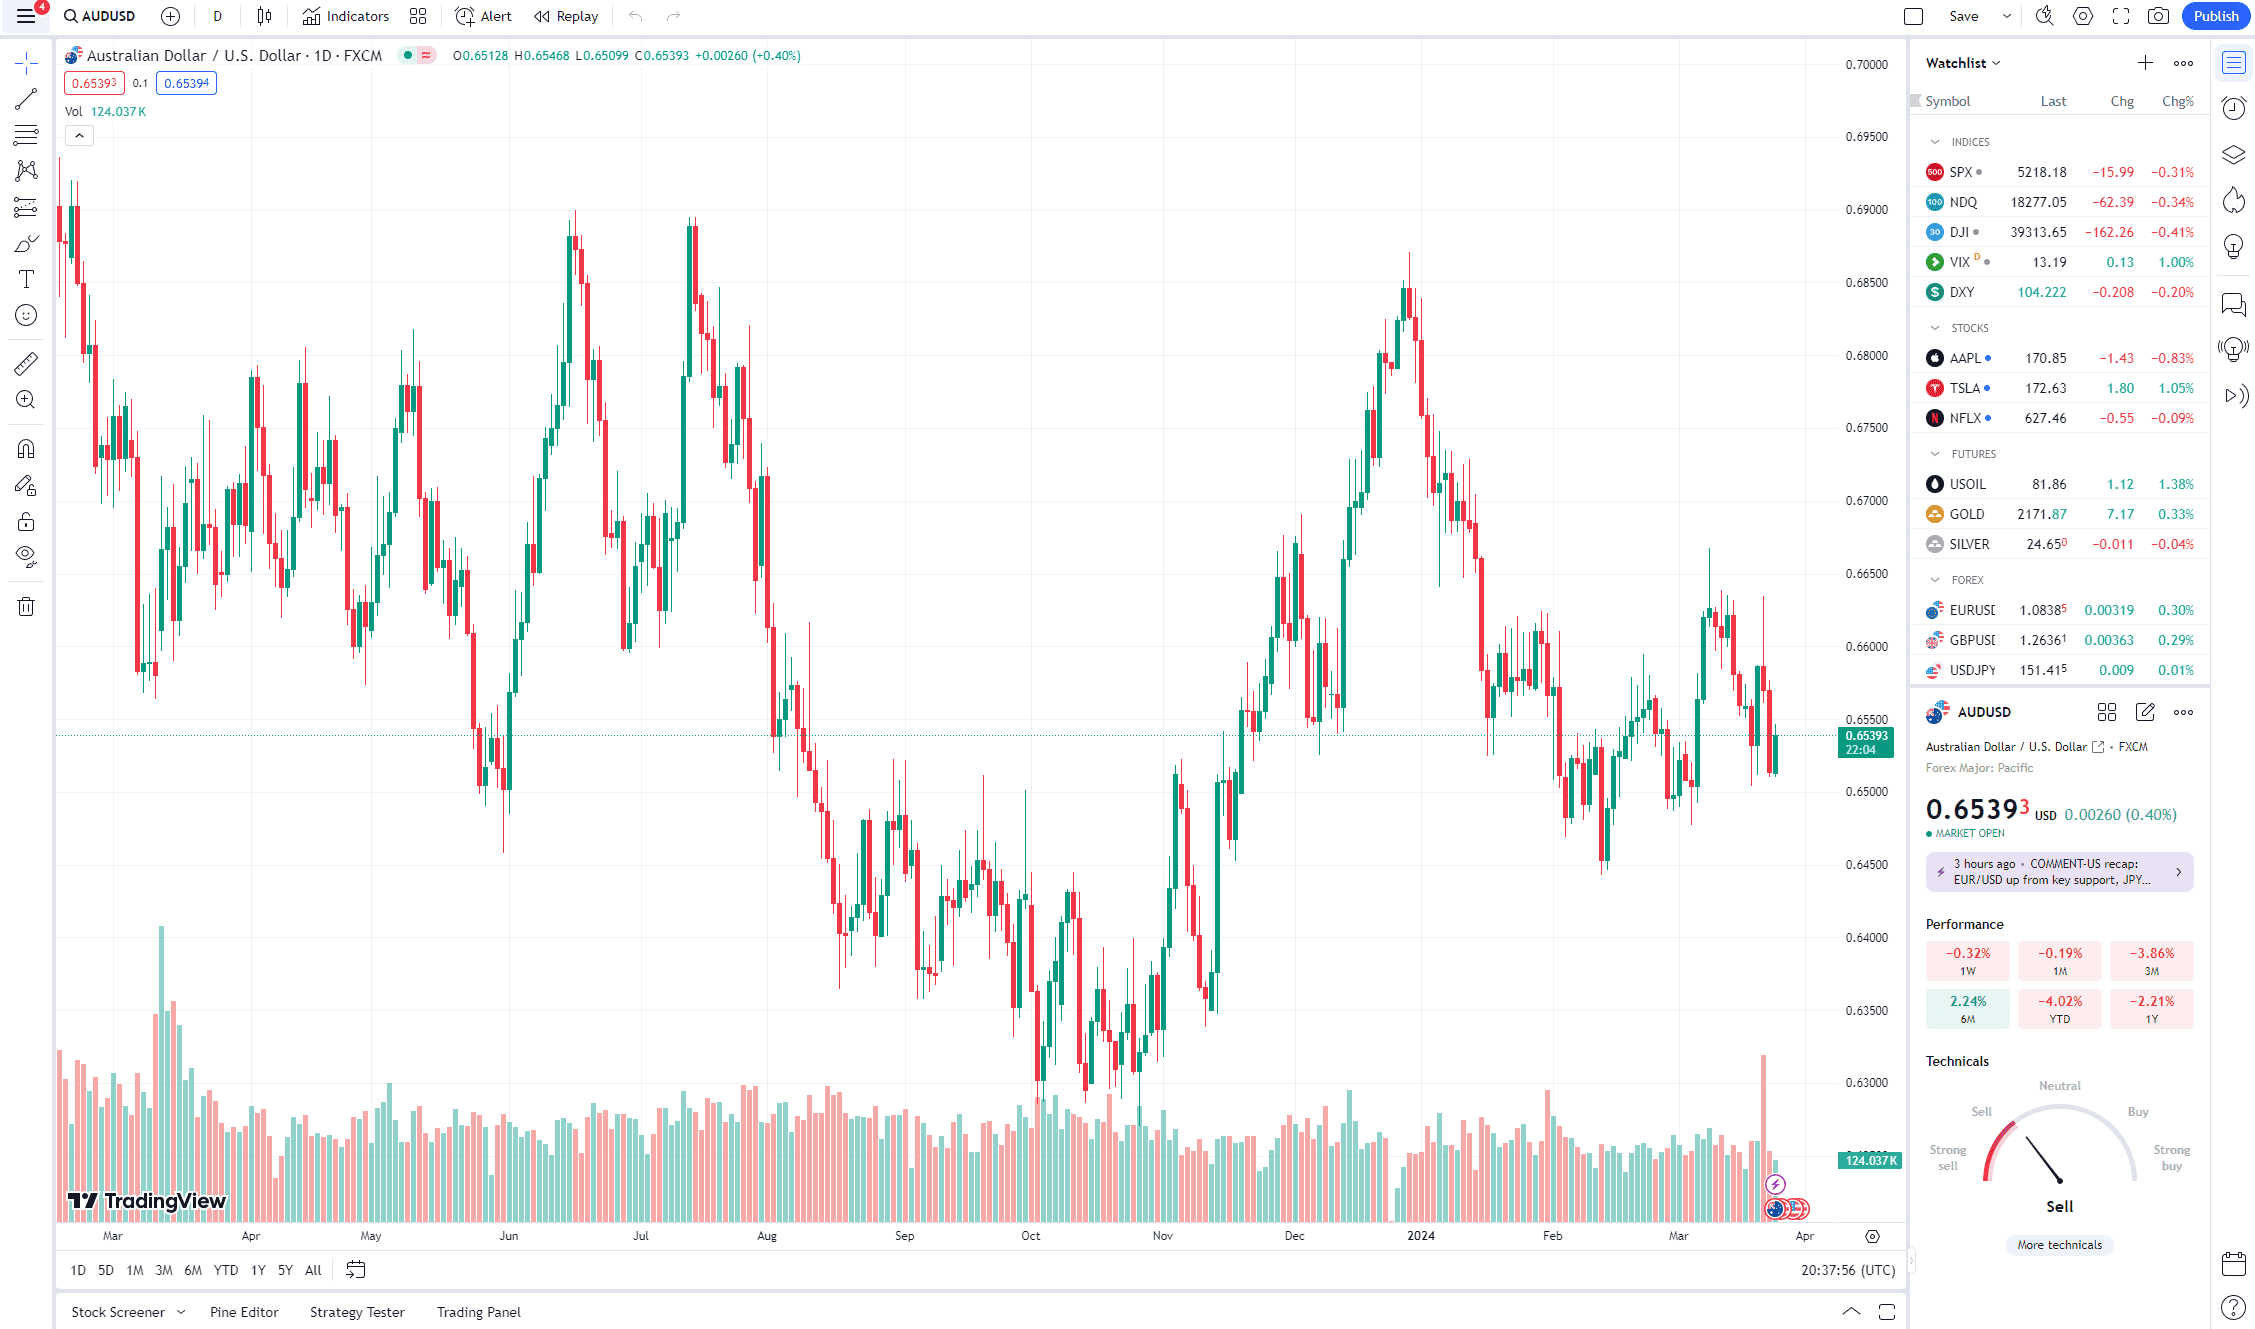
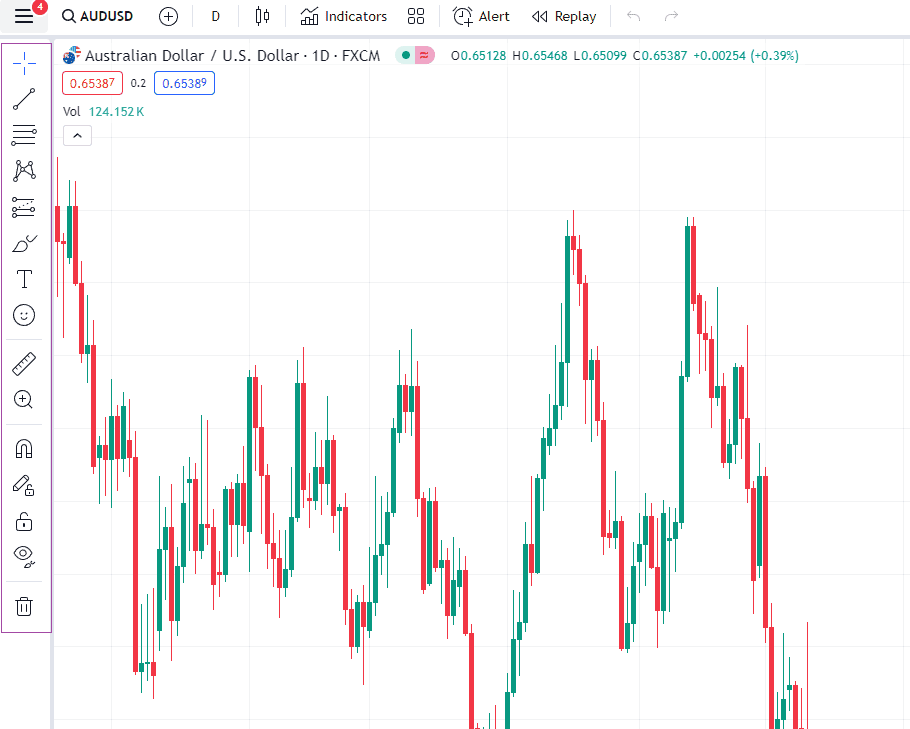
Charting: TradingView offers a wide range of technical indicators, drawing tools, and chart types. The platform offers flexibility in setting candle time frames, ranging from one second to one year. Indicators can be chosen from a drop-down list located in the top toolbar. For additional analysis such as annotation, measuring tools, and trendlines, the platform provides over 90 drawing tools accessible from the toolbar on the left-hand side of the chart.
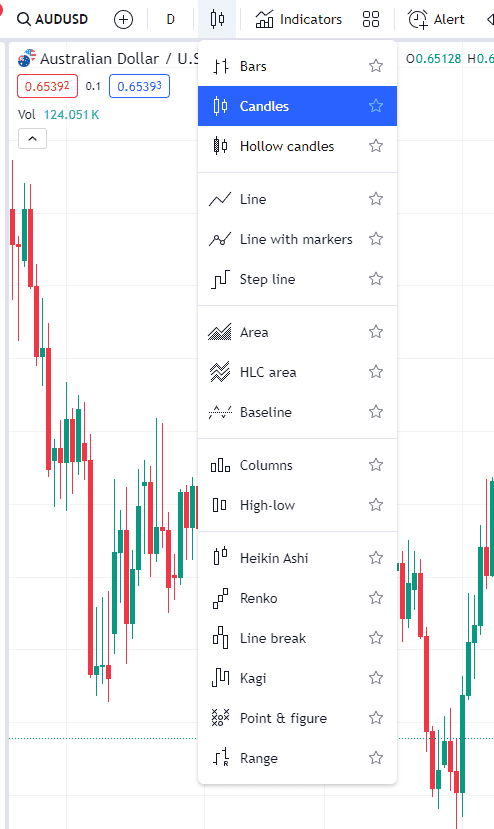
The TradingView platform facilitates the analysis of market data through a variety of chart types, conventionally categorised into two groups.
The first category consists of traditional charts, constructed based on time, including:
- Bars
- Candles
- Hollow candles
- Columns
- Line
- Line with markers
- Step line
- Area
- Baseline
- High-low
The second category comprises charts constructed solely based on price changes, such as:
- Heikin Ashi
- Renko
- Line break
- Kagi
- Point & figure
- Range
Users can easily select their preferred chart type from the drop-down menu located on the top toolbar.
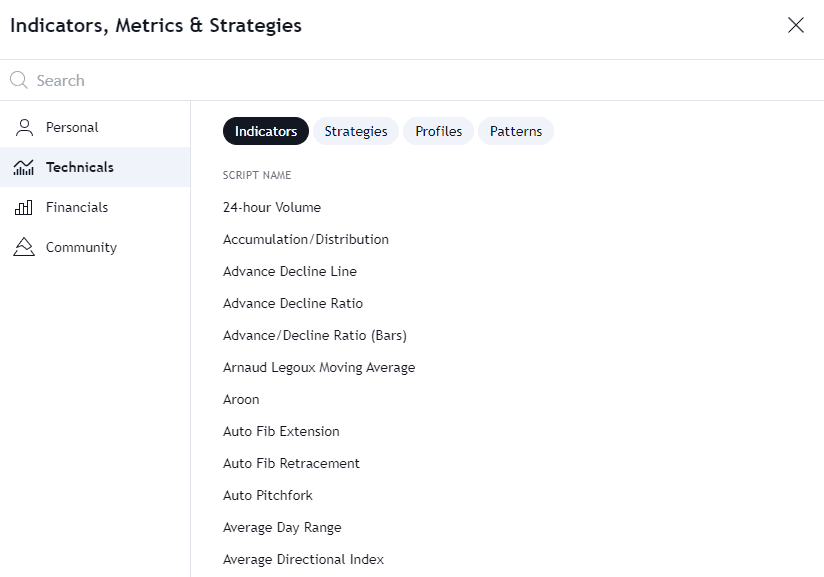
Indicators: TradingView offers a robust selection of over 100 indicators. You can add these to your charts to analyse price movements, trends, and other essential data. Popular indicators include Moving Averages, Relative Strength Index (RSI), and Bollinger Bands. Additionally, users have the flexibility to craft custom indicators in JavaScript through the platform's API. This API empowers users to design a diverse range of indicators, incorporating various plot types, styles, colours, and mathematical functions.
Within the user interface, individuals can seamlessly integrate custom indicators onto the chart. Adjustments to specific indicator parameters can be made using the dedicated Indicators and Settings dialog. It's important to note that while users can add custom indicators and modify certain parameters through the UI, the platform does not allow the creation of entirely new indicators or the modification of existing code for pre-existing ones.
Alerts: TradingView alerts provide instantaneous notifications when the market aligns with your personalised criteria. For instance, you can set an alert such as, "Notify me if Tesla surpasses $250." All users have access to various notification options, including visual pop-ups, audio signals, email alerts, email-to-SMS alerts, and PUSH notifications directly sent to your mobile device.
You can also set alerts on indicators, strategies, and drawing tools and even customise your trigger settings.
Drawing Tools: TradingView's drawing tools offer a versatile range of functionalities, allowing users to make annotations, insert comments, highlight trends and patterns, conduct measurements and forecasts, and calculate price levels. These tools are conveniently positioned on the left panel of the chart, providing easy access for users to enhance their analytical capabilities and visually communicate insights. Whether you need to jot down notes, emphasise specific points, or perform detailed analyses, TradingView's drawing tools allow users to interactively engage with charts and convey valuable information effectively.
Watchlists: Watchlists are located on the right side of the screen. You can create a new watchlist by clicking on ‘Create new list' or import the existing one to keep track of your favourite assets. Please note that the import option is only available for Pro accounts. To add assets to your watchlist, click on the '+’ or ‘X’ if you wish to remove it.
Social Features: The ability to publish and share your trading ideas is a pivotal feature, facilitating collaborative learning. You can exchange trade-related information or engage in discussions about current market conditions with fellow traders who share your level of experience or interact with more seasoned traders.
For a dose of inspiration, navigate to the "Community" section in the header menu and select 'Trade Ideas.' Here, you have the option to explore trade ideas by specific assets, follow the curated selections from editors, or delve into the trending ideas on the platform.
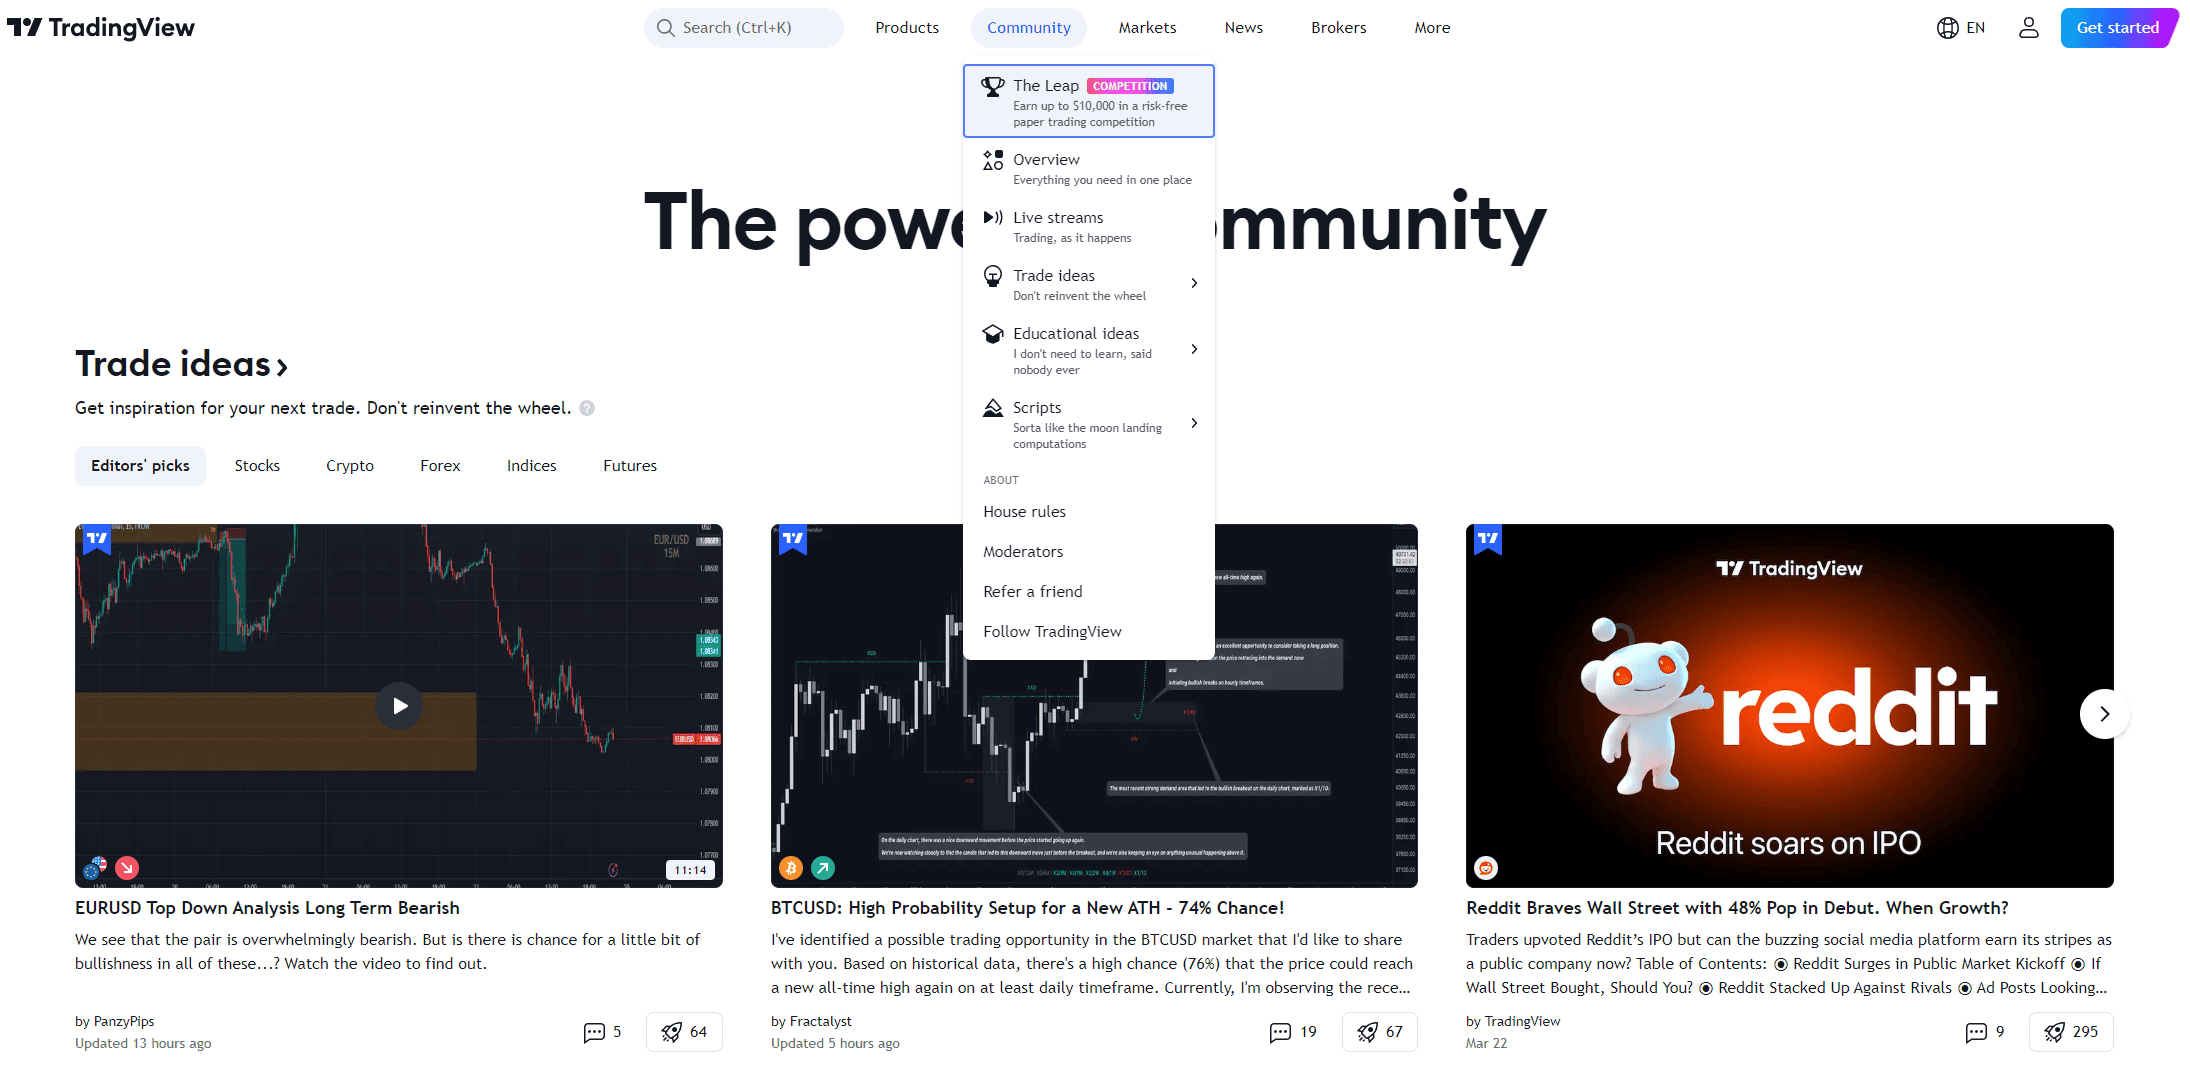
Every member of the community has a badge. Let’s go through them one by one:
- MOD - The red MOD badge is assigned to TradingView moderators, distinguishing them within the community. This badge serves as an additional layer of security for all members, enabling easy identification of moderators. In case you have inquiries or require assistance, this badge helps you discern who is a moderator and who isn't.
![]()
- The BROKER badge, available in blue (platinum), gold, or silver, is designated for broker accounts on TradingView. Members adorned with this badge are exclusively recognised as official broker representatives. The broker page offers comprehensive details on Terms of Use and reviews from live-account owners.
- WIZARD - The green WIZARD badge is awarded to Pine Script™ Wizards, who are exceptional programmers proficient in Pine Script™—the language employed for developing indicators and strategies on TradingView. These Wizards make noteworthy contributions to the community by assisting numerous traders with their code-related queries. Read our blog to learn how to use PineScript for trading on TradingView.
- TradingView official accounts, along with badges for TradingView employees, feature a distinctive blue badge adorned with a TV logo. This badge serves as a visual identifier to distinguish and authenticate the official presence of TradingView and its staff within the community.
The conversations unfold in real time, allowing you to connect with individuals trading the same instruments as you. You can share links to your charts, articulate your trading concepts, and receive feedback and comments to foster mutual growth and prosperity in the trading community. The overarching goal is to enhance your trading and investing skills by gaining insights from the actions of others.
Trading on TradingView
Understanding how to correctly place trades on TradingView is crucial. One of its standout features is Pine Script, a domain-specific programming language that allows users to create custom indicators, strategies, and scripts. Visit our blog [LINK] to learn how you can leverage PineScript for trading on TradingView.
Once you have logged into your trading account, you'll notice four tabs at the bottom: Positions, Orders, Account Summary, and Notifications log. The Orders tab conveniently provides a filter for all possible order statuses. Each column in the Orders tab displays key values from the Account Summary, represented by a grey line.
At the top-right of the Trading Panel, you'll find a menu containing main settings for trading, a button for disconnecting trading, and an option for selecting another broker. Your account ID is prominently displayed, and if it's a multi-account ID, a dropdown allows you to switch between sub-accounts.
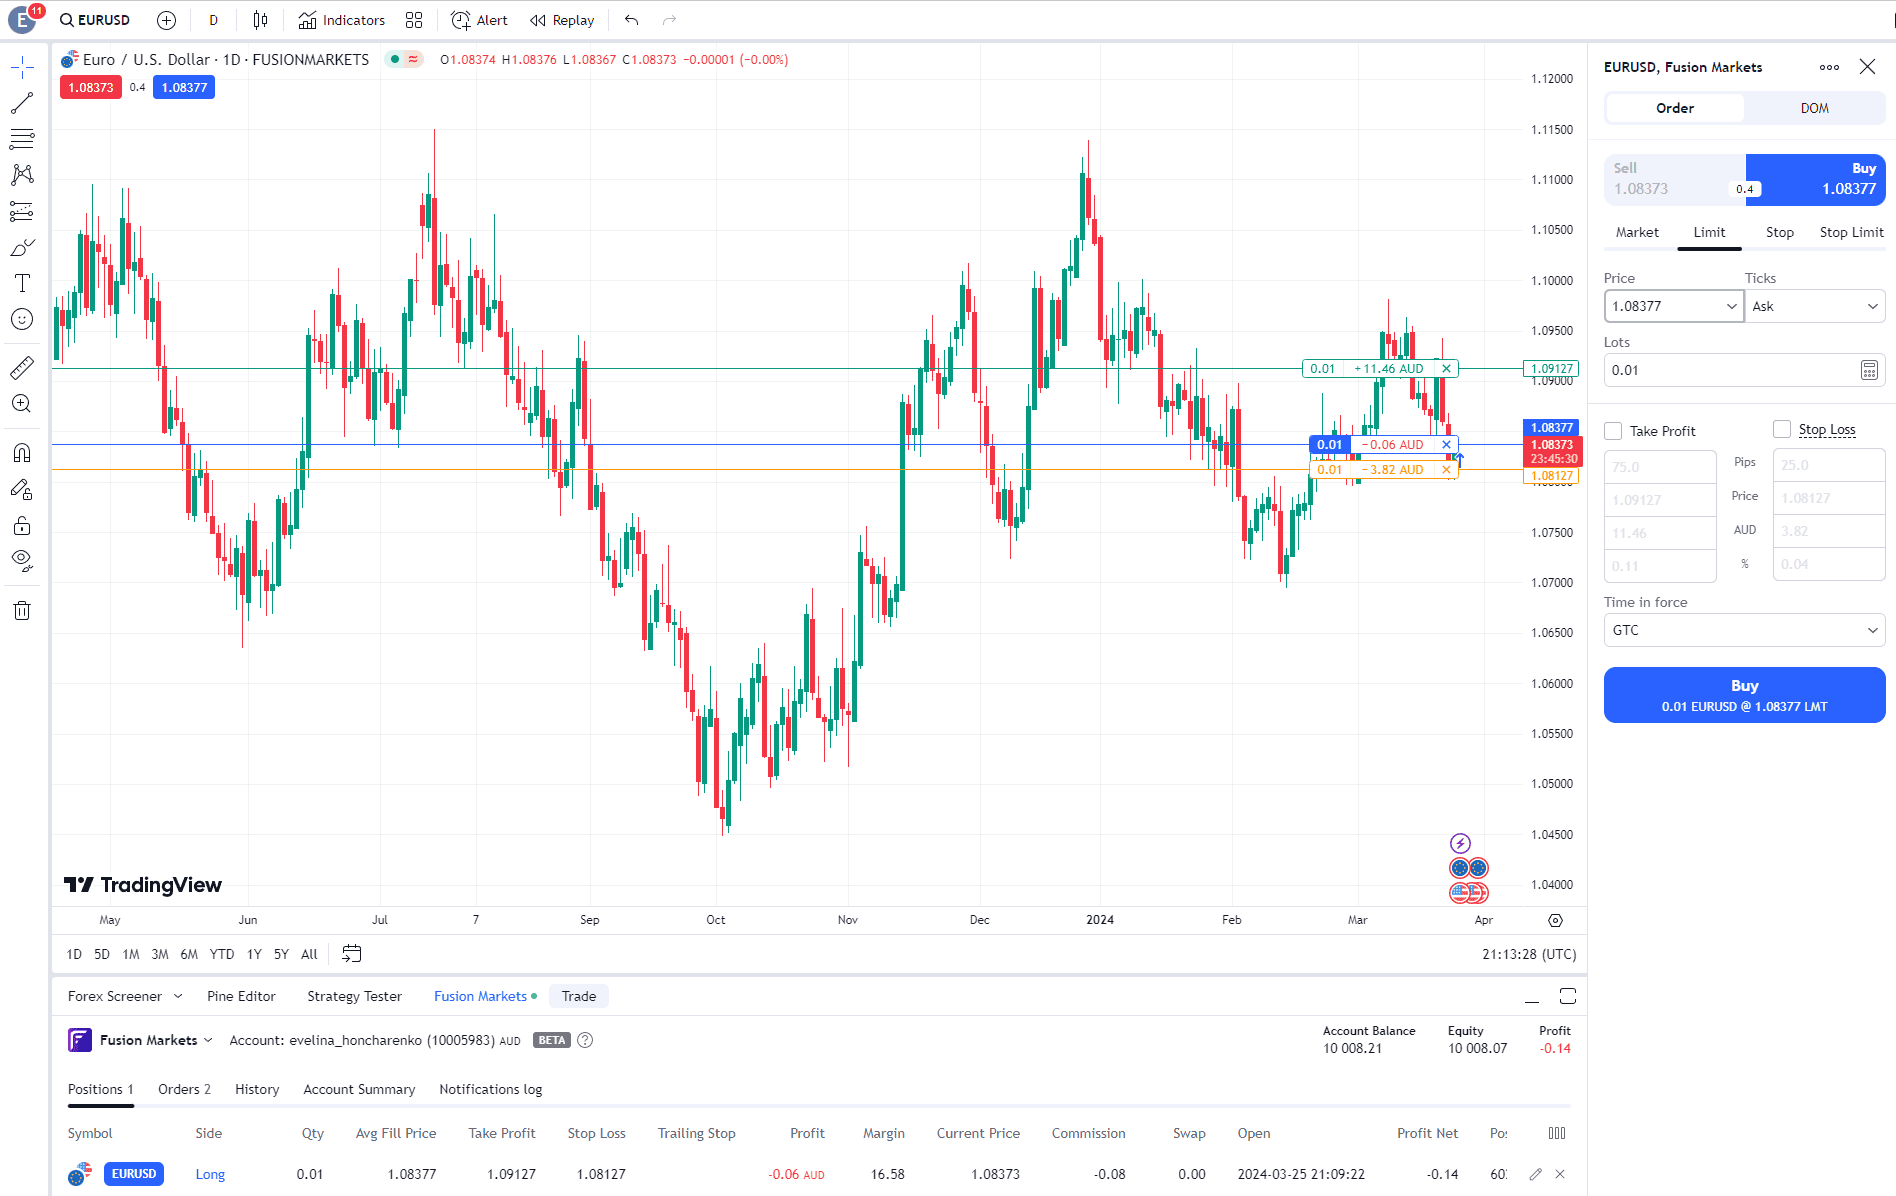
To place an order, you have several options. You can do so through the context menu on the chart or trading panel, the Plus menu on the chart, or by using the Buy/Sell buttons. The easiest way is to click on ‘Trade’ on the trading panel, and a new window will pop up.
When accessing your TradingView execution platform, the Buy/Sell buttons are prominently displayed directly on your chart. In the chart's centre, the market spread is visible, and on the right, you have the option to adjust the number of contracts. Initiating a Buy or Sell order opens the order execution window.
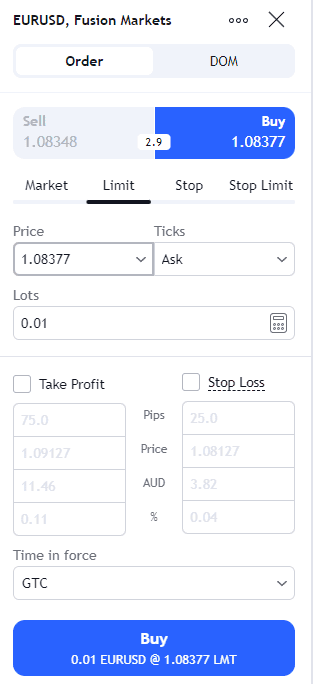
Order Placement: Upon clicking Buy or Sell, you initiate the opening of the execution window and gain the ability to adjust the parameters of your trade before finalising the execution. Let's guide you through each parameter individually:
- Account: If you have multiple accounts, you can seamlessly switch between them at this point.
- Side: Indicate whether your order is a buy or a sell order.
- Type: Select from the following order types: Market, Limit, Stop, or Stop Limit.
- Limit: This order triggers when the price reaches the specified limit or a better price. Note that in situations of imbalance between buyers and sellers, limit orders may not be immediately filled.
- Market: This order gets filled immediately at the best available current price.
- Stop: A stop order that converts into a market order once the specified price is reached.
- Stop Limit: Similar to a stop order, this type converts into a limit order after the specified price is hit.
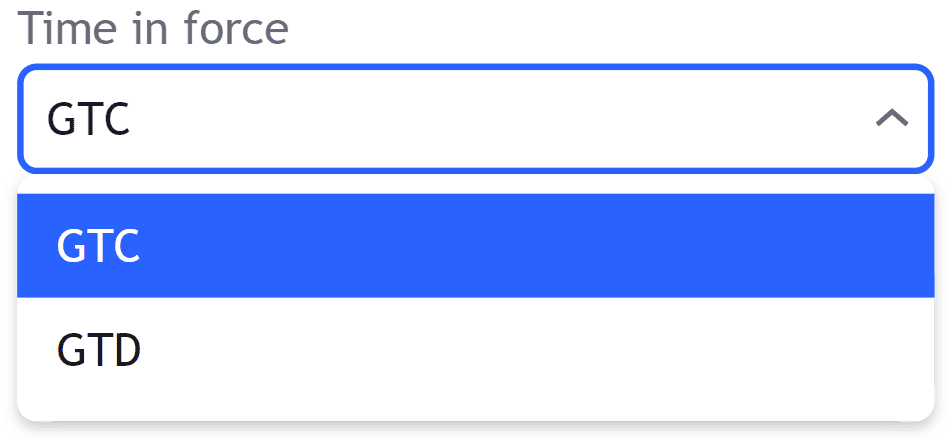
- Duration: You have the flexibility to specify the duration of your order, and TradingView offers various options:
- GTC (Good Till Cancelled): The order persists and stays open until explicitly cancelled by the trader.
- GTD (Good Till Day): The order remains active until the specified date set by the trader.
- Symbol: You can modify the symbol (market) at this point.
- Quantity: Adjust the quantity of contracts you wish to buy or sell.
Managing Positions and Live Trades on TradingView
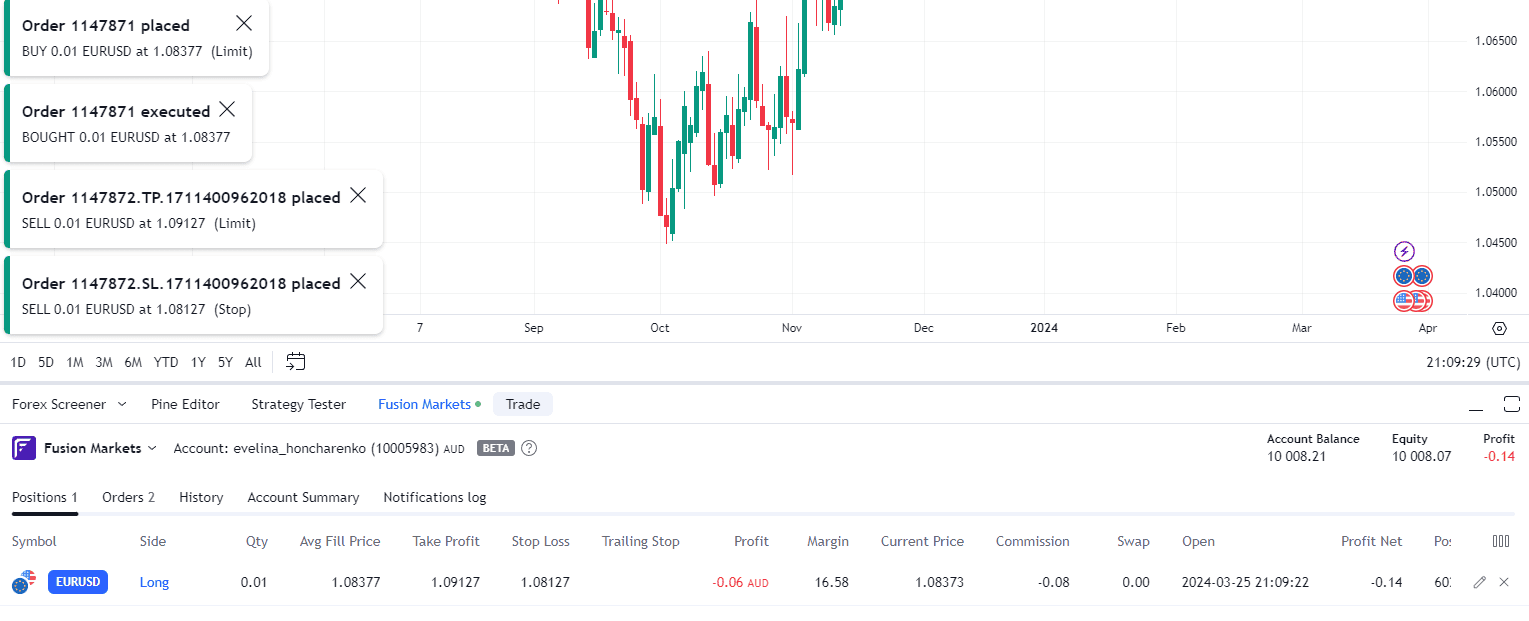
After executing a trade, the details of the trade become visible on your chart. TradingView displays the current Profit/Loss and the quantity of your position.
Additionally, it provides options to reverse your trade, converting a buy trade into a sell trade, or to close your position with a single click. In the Trading Plan section at the bottom of the screen, you can monitor your current positions under "Positions" and access all your active trades with supplementary data. Closing positions can also be done conveniently using the X icon located on the right.
When you enable the visualisation of past trades on TradingView, the platform will display red and green arrows directly on your charts, indicating the entry and exit points of previous positions.
Moreover, you have the capability to view the number of contracts traded, accompanied by the execution date, providing a comprehensive overview of your trading history.
TradingView_Strategies
One of the attractions for millions of retail traders to this platform is the assortment of specialised tools and user-generated strategies available for utilisation at any given time.
Our immediate focus is on understanding how to employ strategies. Without delving into the intricacies of each strategy, let's elucidate how to leverage TradingView using a range of pre-established strategies conveniently accessible on the website.
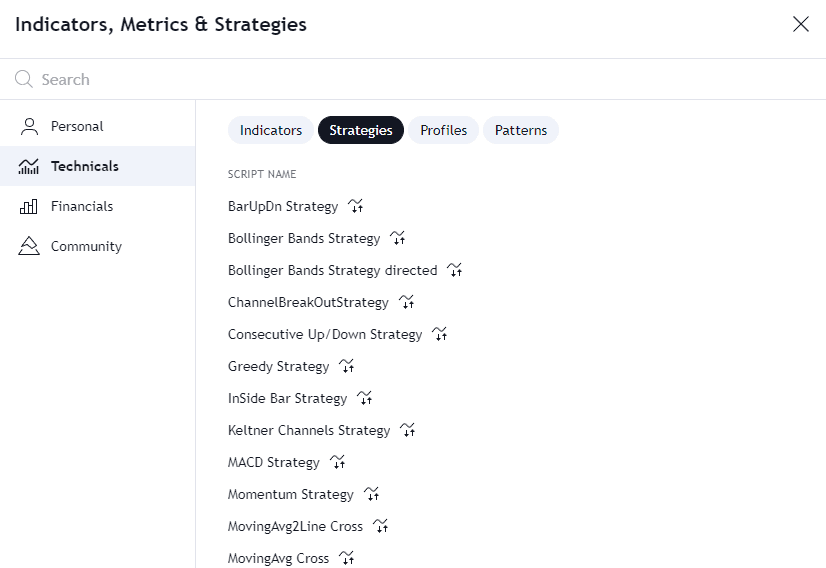
Follow this simplified step-by-step guide:
- Click on "Indicators" in the topmost menu of the TradingView terminal.
- Opt for "Strategies" from the tabs positioned above the list of indicators.
- Select the desired strategy from the new list provided.
If you cannot find the strategy you're looking for, use the search bar for a quick and efficient search.
It's as straightforward as that. As soon as you select a specific strategy, you will see its implementation on the price chart. Additionally, it's essential to understand how to employ multiple charts in TradingView. Some strategies may necessitate cross-comparisons with price data from other assets.
To achieve this, simply click the plus icon next to the name of the primary viewed asset and choose the required asset from the list or use the search feature. This action will promptly overlay one chart over another, offering a more comprehensive view of the price in the context of its comparison against other assets. This feature proves particularly useful when dealing with futures and other derivatives.
Conclusion
Trading on TradingView is a dynamic and multifaceted process that combines technical analysis, strategy development, and community engagement. To succeed, you'll need to continually refine your skills, adapt to changing market conditions, and maintain a disciplined approach to risk management.
Remember, no trading platform, no matter how sophisticated, can guarantee success. It's up to you to apply the knowledge and tools provided by TradingView to make informed decisions and build a profitable trading career. Whether you're a seasoned trader or just starting, TradingView can be a valuable resource on your journey to financial success in the world of trading.
We’ll never share your email with third-parties. Opt-out anytime.