Loading...
No results

Top Forex Events In The New Millennium

Fusion Markets

post content image

Foreign exchange (FOREX) goes through ups and downs. Some events had stripped bare the possible volatility of the market, causing fear in the hearts of investors. Here are some top events since the year 2000 that caused chaos in the markets.


2013 Forex Probe


The Forex Probe of 2013 was a scandal that revealed how international banks had been working together for at least a decade to tweak Forex market exchange rates.  


Again, this event was all about investor fears of market manipulation as a result of bank collusion.  It wasnt easy to trust the market again after such practices were revealed. 


Four major banks admitted involvement, but the 2013 Forex Probe remains one of the most impactful foreign exchange events since 2000, even though the banks paid up $6 billion in fines.  


Greek Debt Crisis


In 2013, the Greek economy revealed its fragility, although it already showed some cracks during the 2007 worldwide financial crisis.  


It looked like Greece was going into an irreparable downfall. Still, the European Union overextended itself by granting it a generous loan of £68 billion. While the EU might have saved Greece, this move would remain one of the top events in Forex history for such a large amount of money changing hands.  


The consequences of the crisis could still be felt as Greece’s debt problems reverberated in 2015. Because Greece couldn’t reach its deal, some currencies surged, such as the Japanese Yen and Swiss Franc found which found themselves on the rise.  


However, other currencies didn’t fare so well in 2015. The Euro plunged in the Asian trading session. The dollar also experienced a one-month low of 122.10 yen.  


Political uncertainty in one country can affect many other countries, and sometimes the impact lasts for years. That is why the Greek Debt Crisis of 2013 makes it to our list of the most significant Forex events in the new millennium.  


2016 Sterling Flash Crash


Since we have already looked at what a flash crash is about, we can go straight to how the Sterling Pound lost its value within seconds on the 7th of October 2016.  


A fat finger error was suspected, but the Bank for International Settlements ruled that there was no proof it was the case. Further investigations revealed that algorithmic trading programs had triggered the crash. The algorithm issue was paired with traders who didn’t want to take much risk.  


GBP/USD - Sep-Nov 2016 - Forex chart


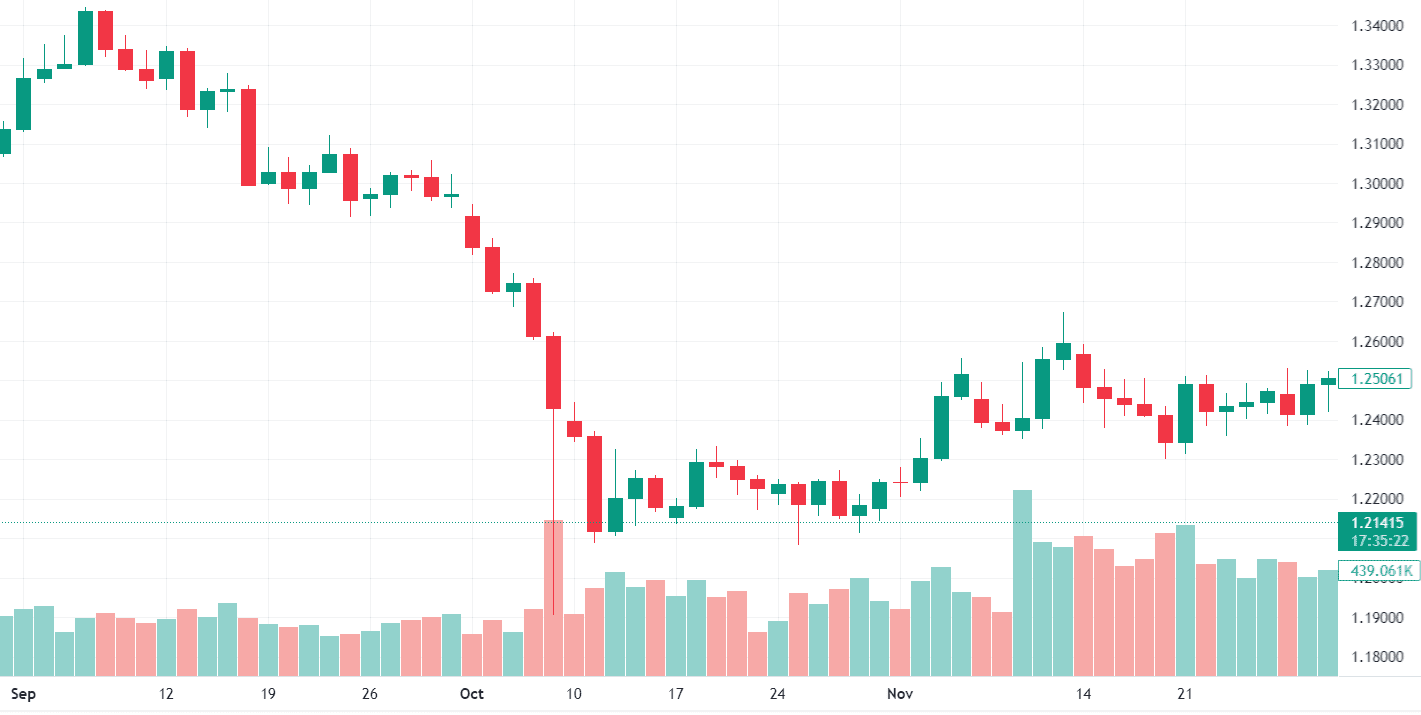
British Pound/U.S. Dollar – Sep-Nov 2016


2016 BREXIT


Brexit 2016 caused panic in the European Union, especially when its economic effects were felt. Of course, it also had an impact on the foreign exchange market. 


The story of Britain’s breakup with the European Union was one of the top events in politics and Forex history. It went to show just how intricately related these aspects were.  


The UK’s unexpected move was what created the panic. Understandably, something so unprecedented had to affect the market. Right before the votes were out, the British pound sterling was moving in an upswing trend. However, it ended in a closing of 8% down for the GBP/USD pair on that day. 


A slide preceded the Brexit-caused slump for about a year.  


USD/JPY and AUD/USD Flash Crash of 2019


You may believe that Apple is mainly influential in the technology market. Think again. Its reaches have some effects on the foreign exchange market, as well.  


Apple’s statement in January 2019 that emphasised the Chinese economy’s struggle had several investors selling their most volatile currencies. 


When investors lose confidence in the Chinese economy, their trust in the AUD and JPY also fluctuates. After all, Australia is its most important trading partner.  


Therefore, a simple statement from Apple in 2019 has caused one of the most significant foreign exchange crashes of recent years.  


undefined


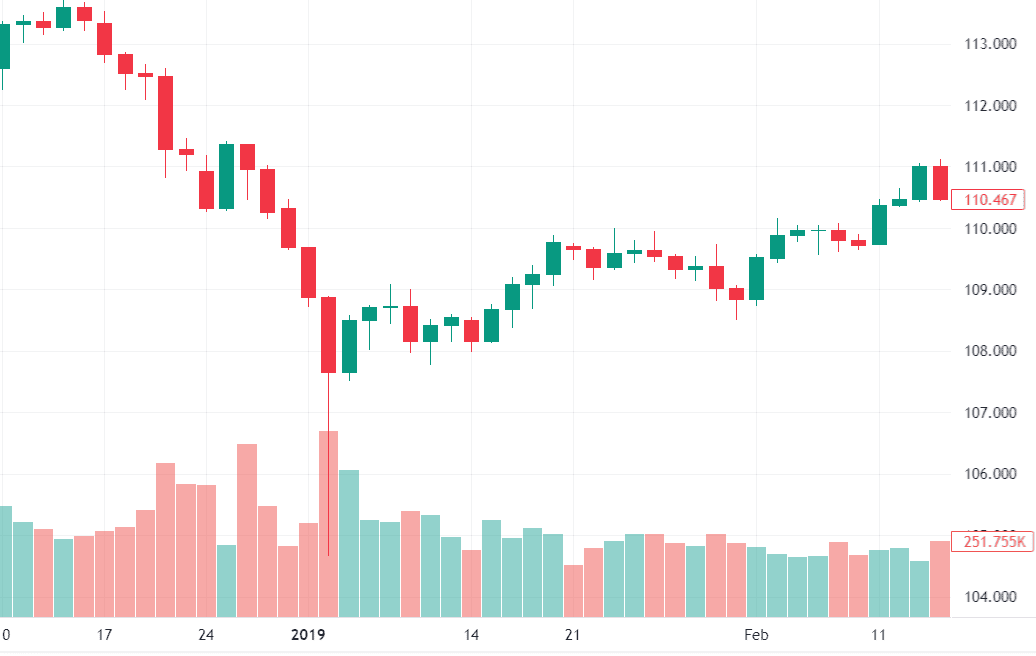
U.S. Dollar/Japanese Yen – Jan 2019


Swiss Francs Crash 


In the same year, in February, the Swiss franc also suffered a crash. However, some considered this an inconsequential event.  


The Swiss Franc experienced a significant drop during the Asian trading session on the 10th of February. It dropped against the US dollar and other major peers.  


When the Japanese markets closed for National Foundation Day, the Swiss francs suffered from a lack of liquidity.  


Another critical Swiss franc crash happened a few years prior to this, in January 2015. The flash rally, as some call it, occurred after the Swiss National Bank announced that its currency would no longer be pegged at 1.20 against the Euro. Because of this, the franc went up by 20% against not only the Euro but also some major currencies.  


2020 Black Swan Event


The Black Swan event certainly caused a stir in the financial markets. Moreover, it points to the fall of the most popular of cryptocurrencies - Bitcoin. 


So, when the cryptocurrency fell to almost 4970 USD per coin, it caused sheer panic among investors. That was an 80% loss in value. For comparison, its 2017 value was at 19716 USD. 


Bitcoin was not alone in creating fear among investors, as Ethereum also dipped from 285 USD to 110 USD. COVID-19 was believed to be the cause of the plunge.  


Because the cryptocurrency crisis of 2022 was considered a Black Swan event, it affected other financial markets, including foreign exchange.  


The fear generated by black swans is especially fearsome due to their ability to wipe out entire accounts. Reliance on standard forecasting tools can fail to predict potential damages, and that is what makes black swan events so rare and devastating. 


Coronavirus Pandemic


The COVID-19 pandemic continues to make its effects known in various industries worldwide. During that crisis economic growth expectations were downgraded in fear that major economic sectors had to be shut down due to the increasing coronavirus cases. That uncertainty reduced the demand for local currencies and investment funds. In addition, it impacted exchange rates and the fluctuating value of the US dollar as a world reserve currency.  


As a result, economic and political measures created significant changes worldwide and left a mark in Forex history. 


Conclusion


While there may be more FOREX-related events in the past and the upcoming future that will affect the market, the above are the ones that still have tangible impacts in the past few years. It is crucial for forex traders to stay ahead of an ever-changing market, and one of the ways to achieve it is to understand its history. 


To access the world’s markets easier and at a lower cost get a live account with Fusion Markets. 


We’ll never share your email with third-parties. Opt-out anytime.

Relevant articles

Trading and Brokerage
post image main
Index CFD Dividends | Week 16/09/2024
Fusion Markets

Please see the table below for any upcoming dividend adjustments on indices for the week starting September 16th, 2024.


undefined

* Please note these figures are quoted in the index point amount


What is a dividend?


Dividends are a portion of company earnings given to shareholders. As indices are often composed of individual shares, an index dividend pays out based on individual shares proportional to the index’s weighting.


Trading on a CFD Index does not create any ownership of the underlying stocks, or an entitlement to receive the actual dividends from these companies.


What is an ex-dividend date?


An ex-dividend date is the cut-off date a share must be owned in order to receive a dividend. If an investor buys a share after the ex-dividend date, then they will not be entitled to earn or pay the next round of dividends. This is usually one business day before the dividend.


Do dividends affect my position?


Share prices should theoretically fall by the amount of the dividend. If the company has paid the dividend with cash, then there is less cash on the balance sheet, so in theory, the company should be valued lower (by the amount of the dividend).


Due to the corresponding price movement of the stock index when the ex-dividend date is reached, Fusion must provide a 'dividend' adjustment to ensure that no trader is positively or negatively impacted by the ex-dividend event.


How will the dividend appear on my account?


The dividend will appear as a cash adjustment on your account. If your base currency is different from the currency the dividend is paid out in, then it will be converted at the live FX rate to your base currency.


Why was I charged a dividend?


Depending on your position, given you are holding your position before the ex-dividend date, you will either be paid or charged the amount based on the dividend. Traders shorting an index will pay the dividend, whereas traders who are long the index will be paid the dividend.


Why didn’t I receive my dividend?


You may not have received a dividend for a number of reasons:


- You entered your position after the ex-dividend date

- You are trading an index without dividend payments

- You are short an index


If you believe the reasons above do not apply to your position, please reach out to our support team at [email protected] and we’ll investigate further for you.


Forex Trading
CFD
Dividends
16.09.2024
Trading and Brokerage
post image main
The Real Cost of Forex Trading
Fusion Markets
Understanding the characteristics of the forex market is crucial for success. The concept is simple; forex trading involves buying and selling currencies with the aim of making a profit. However, many new traders dive into this market without fully grasping the real costs involved. In this guide, we'll explore the hidden expenses that can impact your trading profitability and provide tips to incorporate into your trading and avoid any unnecessary costs.


Understanding the Hidden Costs


Spread and Commissions


When trading forex, you'll encounter bid and ask prices. The bid price is what buyers are willing to pay, while the ask price is what sellers are asking for. The difference between these two prices is known as the spread. This spread represents the cost of trading and can vary depending on market conditions and the broker you're using. Additionally, account types such as Fusion Markets’ Zero account, don’t have a spread, but rather commissions on each trade. This can be beneficial to traders who are looking for a regular-cost solution.


Understanding the impact of spread on trading costs is essential. Even seemingly small spreads can add up over time, affecting your profitability. Different brokers offer various commission structures, including fixed or variable spreads and commission-based pricing. It's crucial to compare these structures and choose the one that aligns with your trading strategy.


Overnight Financing Fees


When holding positions overnight, you may incur overnight financing fees, also known as swap rates. These fees are charged for the privilege of keeping a position open beyond the trading day. Calculated based on the interest rate differential between the two currencies being traded, overnight financing fees can eat into your profits over time. Long-term traders should carefully consider these fees as they can significantly impact overall profitability if you’re holding a position with a negative swap for multiple days or weeks.


Slippage


Slippage occurs when the execution of a trade differs from the expected price. It can be caused by market volatility, liquidity issues, or delays in order execution. Slippage can lead to unexpected losses or reduced profits, especially during fast-moving markets or when trading large positions.


To minimise slippage, traders can use limit orders, advanced trading algorithms, or avoid trading during periods of high volatility, such as major news releases or the day rollover.


Tools for Transparent Financial Analysis


Fusion Markets Spreads Tool


Trading Journal


Keeping a detailed trading journal is essential for tracking your performance and identifying areas for improvement. Your journal should include details such as entry and exit points, trade duration, position size, and reasons for entering the trade. Analysing this data can help you identify patterns in your performance, enabling you to refine your strategy, and optimise your trading approach.


Performance Metrics


Key performance metrics such as win rate, risk-reward ratio, and drawdown are valuable tools for evaluating your trading performance. A high win rate alone does not necessarily indicate success if the risk-reward ratio is unfavourable or if drawdowns are excessive. By calculating and interpreting these metrics, you can gain insights into the effectiveness of your trading strategy and make adjustments accordingly.


For example, a trader might have a win rate of 70% but still not be profitable. By analysing their performance metrics, the trader can identify that they have an inadequate risk-reward ratio; meaning that their losing trades are, on average, larger in value than their winning trades.


Historical Data Analysis


By leveraging past market movements and trends, traders gain valuable insights for informed decision-making. Whether assessing the viability of a trading strategy or gauging potential risks, historical data provides a rich tapestry of information.


Using historical data, traders can back-test strategies. Back-testing involves testing a trading strategy using historical data to see how it would have performed under past market conditions.


By incorporating historical data into risk management practices, a trader can better anticipate potential risks and adjust their strategies accordingly.


In the ever-changing world of trading, historical data becomes like a guiding light, preparing us for what could happen, based on previous events. In turn, this knowledge allows traders to make more informed decisions. You can view Fusion’s Live and Historical spreads to stay informed.


Tips for Transparent Financial Analysis


undefined


Set Realistic Profit Expectations


It's essential to set realistic profit expectations based on your trading strategy and risk tolerance. Avoid overestimating potential profits and understand the relationship between risk and reward. Remember that trading involves inherent risks, and losses are inevitable.


Practice Risk Management


Implementing proper risk management techniques is crucial for preserving your capital and long-term success. This includes setting stop-loss orders to limit potential losses and employing position sizing strategies to manage risk exposure effectively.


Managing open trades by tightening your stop as the derivative moves in your intended direction can also boost your R-multiple and improve your return over the long-run.


Continuously Educate Yourself


The forex market is dynamic and constantly evolving, so staying up to date on market trends and developments is essential. Continuously educate yourself through books, online courses, and seminars to refine your skills and stay ahead of the curve.


Choosing Reputable Brokers with Transparent Fee Structures


Selecting a reputable broker with transparent fee structures is paramount. Before committing to a broker, thoroughly research their reputation, regulatory compliance, and fee structures. Don't hesitate to ask questions and seek clarification on costs to ensure transparency and avoid unexpected expenses. 


Conclusion


Navigating the hidden costs of forex trading requires a combination of knowledge, skill, and diligence. By understanding the various expenses involved, utilising tools for transparent financial analysis, and practising sound risk management, new traders can increase their chances of success in the forex market. Continuously educate yourself, choose reputable brokers, and always prioritise transparency in your trading endeavours.


If you want to know more about Fusion Markets, our products, fee structures and services, please contact a member of our friendly team or visit our live chat on our site. 

Forex
Trading
Tips
08.08.2024
Ready to Start Trading?
Get started live or get a free demo