Loading...
No results

Exploring Different Trading Instruments

post content image

Read time: 12 minutes.


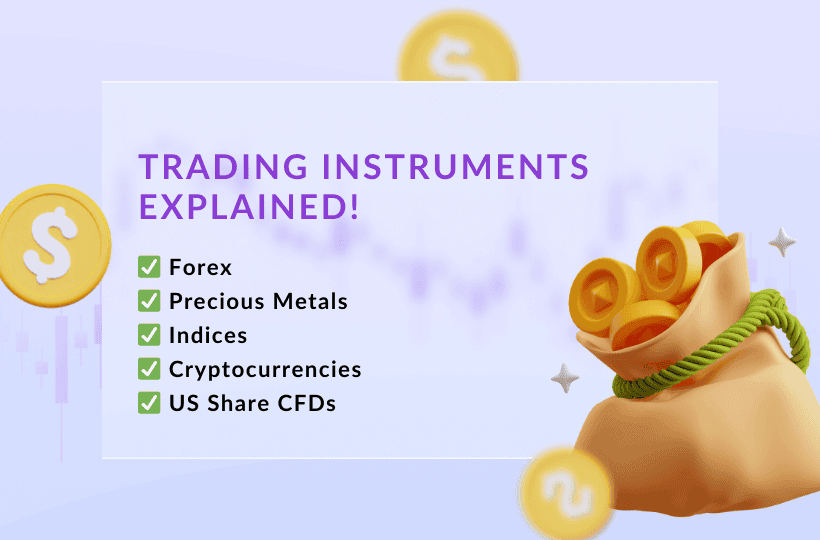
A diverse range of trading instruments is available in the financial markets, each presenting its own set of opportunities and challenges for investors.


Forex stands out as the largest and most liquid market globally, facilitating currency exchange 24/5 across major financial centers worldwide. Meanwhile, precious metals like gold, silver, and platinum hold enduring appeal as timeless assets valued for their intrinsic worth and utility across various industries.


  • Indices, such as the S&P 500, offer snapshots of broader market performance, guiding investors in tracking trends and making informed decisions about resource allocation.
  • Cryptocurrencies, such as Bitcoin and Ethereum, have disrupted traditional finance with their decentralized and highly volatile nature, reshaping the financial landscape.
  • US share CFDs provide traders with leveraged exposure to American equities without owning the underlying assets, opening up avenues for speculation and hedging within the dynamic US stock market.


Understanding the distinct characteristics and dynamics of each trading instrument is crucial for navigating the financial markets effectively. Each instrument has its own unique features, including liquidity, volatility, and correlations with other assets, which significantly impact trading strategies and risk management approaches.


For example, forex trading thrives on its liquidity and accessibility but is also prone to significant volatility and sensitivity to economic indicators. On the other hand, precious metals often serve as safe-haven assets during times of economic uncertainty but are subject to supply and demand dynamics and geopolitical tensions.


By understanding each asset's characteristics, traders can tailor their strategies to suit specific instruments, maximizing opportunities and mitigating risks for consistent and profitable trading outcomes.


Forex Icon

Forex Trading


The foreign exchange market is a global decentralized marketplace where currencies are traded. Participants include banks, financial institutions, corporations, governments, and individual traders.


Currency pairs represent the exchange rate between two currencies. The most commonly traded pairs include EUR/USD (Euro/US Dollar), GBP/USD (British Pound/US Dollar), and USD/JPY (US Dollar/Japanese Yen). Each pair consists of a base currency and a quote currency, with the exchange rate indicating how much of the quote currency is needed to purchase one unit of the base currency.


Forex trading operates 24 hours a day, five days a week, across major financial centers worldwide, including London, New York, Tokyo, and Sydney. This continuous trading cycle allows for around-the-clock trading, providing ample opportunities for market participants to engage in buying and selling currencies.


What moves prices


Many factors contribute to the volatile price movements. Economic indicators play a significant role, including interest rates, inflation rates, gross domestic product (GDP) growth, employment figures, and trade balances. Central bank policies, such as monetary policy decisions and interventions in currency markets, can also impact currency valuations.


Geopolitical events and developments, such as political instability, trade tensions, and conflicts, can cause sudden shifts in investor sentiment and currency flows. For example, the current conflicts in Ukraine and Gaza.


Market sentiment, driven by speculation, fear, and greed, can lead to short-term fluctuations in currency prices. Traders often employ a combination of fundamental and technical analysis to anticipate market movements and make informed trading decisions in the dynamic forex market environment.


Cryptocurrency


Precious Metals Trading


Precious metals, including gold, silver, and platinum, have captivated humanity for centuries due to their inherent beauty, scarcity, and utility.


Gold, often referred to as the "king of metals," holds a special place in history as a symbol of wealth, luxury, and stability. Its lustrous appearance and resistance to corrosion make it ideal for jewellery and ornamental purposes.


Silver, known for its affordability and versatility, boasts a wide range of industrial applications, from electronics to medicine.


Platinum, rarer and more precious than gold, is coveted for its durability and resistance to tarnishing, primarily used in catalytic converters, jewellery, and laboratory equipment. Together, these precious metals form the cornerstone of investment portfolios, serving as safe-haven assets and hedges against inflation and economic uncertainty.


What moves prices


The prices of precious metals are influenced by a complex interplay of supply and demand dynamics, along with various economic factors.


On the supply side, mining production, exploration efforts, and recycling rates impact the availability of precious metals in the market. Geopolitical factors, including mining regulations, labor strikes, and geopolitical tensions, can disrupt supply chains and affect production levels.


Demand for precious metals stems from diverse sources, including jewellery fabrication, industrial manufacturing, investment demand, and central bank reserves.


Economic indicators, such as interest rates, inflation expectations, and currency valuations, also exert significant influence on precious metals prices. For instance, during times of economic uncertainty or inflationary pressures, investors flock to precious metals as store-of-value assets, driving prices higher. On the contrary, a strengthening economy or rising interest rates may dampen demand for precious metals, leading to price declines.


Understanding these supply and demand dynamics, coupled with macroeconomic trends, is essential for investors and traders seeking to navigate the intricacies of the precious metals market.


Stock Market Image

Indices Trading


Stock market indices, such as the S&P 500, play a pivotal role in providing investors with insights into the performance of specific segments of the financial markets. The S&P 500, for example, represents a diverse basket of 500 large-cap US companies, spanning various industries and sectors. These indices serve as benchmarks, allowing investors to gauge the overall health and direction of the stock market. Additionally, they facilitate portfolio diversification and asset allocation strategies by providing a broad overview of market trends and movements.


Stock market indices are calculated using weighted averages of constituent stocks' prices or market capitalizations. The weighting methodology varies depending on the index, with some indices employing market-cap weighting, where larger companies exert a greater influence on the index's performance, while others utilize price weighting or equal weighting.


What moves prices


Changes in the prices of constituent stocks, driven by factors such as corporate earnings, macroeconomic indicators, and investor sentiment, impact the index's value.


Indices are rebalanced periodically to reflect changes in market dynamics, ensuring their relevance and accuracy in tracking overall market performance. By tracking indices, investors can assess the performance of their portfolios relative to the broader market, identify trends, and make informed investment decisions based on market benchmarks.


undefined

Cryptocurrency Trading


The cryptocurrency markets exhibit unique features that distinguish them from traditional financial markets, with volatility and decentralization standing out as prominent characteristics.


Volatility, fuelled by speculative trading, market sentiment, and regulatory developments, is inherent to cryptocurrency markets, leading to rapid price fluctuations and heightened risk.


Additionally, cryptocurrencies operate on decentralized blockchain networks, bypassing traditional financial intermediaries like banks and enabling peer-to-peer transactions. This decentralization fosters transparency, security, and censorship resistance, empowering individuals to control their assets and participate in a borderless financial ecosystem.


Despite the challenges posed by volatility and regulatory uncertainty, the decentralization of cryptocurrencies continues to disrupt traditional financial systems, offering a glimpse into the future of finance.


undefined

US Share CFDs Trading


US Share CFDs trading offers investors a flexible and leveraged approach to accessing US equity markets without owning the underlying assets. 


Contracts for Difference (CFDs) allow traders to speculate on the price movements of US shares, including popular companies such as Apple, Google, and Amazon, without the need for direct ownership.


CFDs provide flexibility, enabling traders to take both long and short positions on US shares, thereby capitalizing on both rising and falling markets. However, it's essential to acknowledge the risks associated with CFD trading, such as leverage-induced losses, counterparty risk, and overnight financing charges.


In addition to maintaining strict risk management, traders need to stay informed about market developments and conduct thorough research to mitigate risk and achieve long-term success in trading US share CFDs.


Click here for more information on the trading products provided by Fusion Markets.


undefined

Choosing the Right Trading Instruments


Selecting the right trading instruments is a critical decision that hinges on various factors, including individual trading goals, experience level, and risk tolerance.


Novice traders may opt for instruments like forex or precious metals, known for their liquidity and relatively lower entry barriers.


Experienced traders, on the other hand, might explore more complex instruments such as cryptocurrencies or US share CFDs, leveraging their market knowledge and risk management skills.


It's essential to align chosen instruments with specific trading objectives, whether it be short-term speculation or long-term investment. Additionally, understanding one's risk tolerance is essential, as certain instruments, like cryptocurrencies, are inherently more volatile than others and may not suit everyone's risk appetite.


Diversification and portfolio management also play a crucial role in mitigating risk and optimizing returns when trading multiple instruments. Diversifying across different asset classes, such as stocks, bonds, commodities, and currencies, helps spread risk and minimize exposure to any single market or sector.


Additionally, within each asset class, diversification can be achieved by selecting a mix of instruments with varying risk profiles and correlations. Effective portfolio management involves regularly reviewing and rebalancing the portfolio to ensure alignment with changing market conditions and investment objectives. By diversifying and actively managing their portfolios, traders can enhance resilience against market fluctuations and achieve more consistent and stable returns over the long term.


Conclusion


Navigating the diverse array of trading instruments demands a comprehensive understanding of their respective characteristics and dynamics. From the liquidity of forex markets to the resilience of precious metals, each instrument presents unique opportunities and challenges for traders.


By embracing sound risk management principles, honing analytical skills, and aligning trading strategies with individual objectives, market participants can prosper in any market environment.


As you dive deeper into the world of trading, we encourage you to explore our range of products and accounts at Fusion Markets, empowering you to seize opportunities and chart your path to financial success.


We’ll never share your email with third-parties. Opt-out anytime.

Relevant articles

Beginners
post image main
The Fibonacci Cheat Sheet

Read Time: 6-7 minutes


Essential Ratios Every Beginner Trader Should Know. The Fibonacci sequence and the golden ratio have long fascinated mathematicians, scientists, and artists. Their influence extends across every aspect in life and can be observed in nature, architecture, and even the financial markets. Fibonacci-based tools are readily available and can assist in identifying entry and exit points, retracement lengths and more.


What is Fibonacci and Why Does It Matter in Trading?


The Fibonacci sequence consists of a series of numbers where each value is the sum of the two preceding numbers, starting from 0 and 1. For example, 1+1=2, 1+2=3, 2+3=5, and so on. When we continue this pattern we get:


0, 1, 1, 2, 3, 5, 8, 13, 21, 34, 55, 89, 144, 233...


Taking it one step further, if we observe the mathematical correlations between these numbers, we identify a range of ‘ratios’. For example, if we divide 21 by 34, we get 0.618%. If we divide 21 by the number two spots to the right (55), we get 38.2 and so on.


This mathematical constant appears in various natural and human-made structures, from spiral galaxies to architectural designs, and even nature.

undefined

In trading, Fibonacci ratios can help analyse price action, pinpointing areas where market trends may pause, reverse, or accelerate. By learning to apply these ratios, you can identify potential support and resistance levels, retracement zones, and projected price targets, ultimately giving you better entries and exits on your trades.


Breaking Down the Key Fibonacci Ratios


The most widely used Fibonacci ratios in forex trading originate from the relationships between sequence numbers. As an example, some of the most commonly used in trading include:


  • 23.6% – A minor retracement level often observed in strong trends.
  •      
  • 38.2% – A commonly used retracement level where price corrections may occur.
  •      
  • 50% – Not an official Fibonacci ratio, but significant due to psychological factors.
  •      
  • 61.8% – The golden ratio, a crucial level for support and resistance.
  •      
  • 78.6% – A deeper retracement level where strong reversals may occur.
  •      
  • 161.8% – A common extension level used to forecast potential price targets.
  •    
   

These ratios are applied using Fibonacci retracements and extensions.


How to Use Fibonacci Retracements   


We have explained Fibonacci retracements as one of the indicators that we have discussed here on our blog before. A trend is a significant price movement in one direction, followed by a price movement in the opposite direction, followed by a price movement in the direction of the initial trend. You can use Fibonacci retracement levels to determine where these pullbacks might find support or resistance. You can get better entries and/or exits on your trades by doing this.

 undefined

Fibonacci Retracements


For example, during a bullish trend, price may retrace to the 38.2%, 50%, or 61.8% level before continuing higher. This can also be observed in a downtrend, where these levels can serve as potential swing points where price might pause or reverse before resuming its downward trend.


How to Use Fibonacci Extensions


While retracements focus on pullbacks, Fibonacci extensions project potential price targets beyond the original price movement, using the same ratios. These levels help estimate how far price may travel after a retracement completes – ultimately leading to better profit targets/exit points.


The 161.8% extension, often called the "golden mean," is one of the most significant levels. It frequently acts as a target in strong trends, marking potential areas where price may consolidate or reverse.


Extensions are particularly useful for setting profit targets, as they provide logical exit points based on prior price action.


A graph with a line and a dotted line


AI-generated content may be incorrect.


Fibonacci Clusters: Combining Multiple Levels for Strong Trade Setups


A Fibonacci cluster forms when multiple Fibonacci levels from different price swings converge at a similar price point. These clusters can help identify the stronger swing points, which often lead to market reactions.


Traders often use these clusters for:


  • Identifying precise entry points
  •    
  • Setting stop-loss levels
  •    
  • Establishing profit targets


  •  


Figure 1 – AUDUSD Weekly Chart


For instance, if a 61.8% retracement from a major trend aligns with a 161.8% extension from a smaller move, the resulting zone becomes a high-probability trade area.


Step-by-Step Guide to Using Fibonacci in Your Trading


To effectively use Fibonacci techniques in forex trading, follow these steps:


  1. Identify Key Price Swings – Look for significant highs and lows as reference points for Fibonacci retracement or extension tools. It’s important that you’re drawing the tool using the correct swing high and lows of each move.
  2.    
  3. Plot Fibonacci Levels – Use charting software, such as MetaTrader or TradingView, to overlay Fibonacci levels on key price movements.
  4.    
  5. Look for Areas of Confluence – Check if the Fibonacci levels align with other technical indicators, such as moving averages, trendlines, support/resistance zones, or even other Fibonacci levels.
  6.    
  7. Observe Price Reactions – Monitor how the market responds to each Fibonacci level, looking for confirmation through price action signals like candlestick patterns.
  8.    
  9. Manage Risk Effectively – Define risk-reward parameters using Fibonacci-based stop-loss and take-profit levels.
  10.  
 

Final Thoughts


The Fibonacci sequence and golden ratio help to structure the way the market behaviour is analysed, and the major price levels are identified. You can enhance your technical analysis and, by result, decision-making, by applying Fibonacci retracements, extensions, and clusters.


However, it is crucial to mention that no tool is 100% accurate and that the use of Fibonacci tools can greatly enhance a sound trading strategy by providing more potential entry and exit points. However, like any other indicator, there are no guarantees, so it is recommended to look for a reaction and/or confirmation of each Fibonacci level before making the trade.


18/03/2025
Beginners
post image main
Leveraging Economic Indicators

Read Time: 6 minutes


For successful forex trading, economic indicators are essential tools in understanding market trends and predicting potential currency movements. These indicators, such as GDP, employment data, inflation rates, and more, provide a window into the economic health of a country, which ultimately influences currency values across the market.  

Understanding the influence of economic indicators allows you to make informed decisions based on more accurate analysis, increasing the likelihood of profitable trades.  


Table of Contents


Key Economic Indicators


Gross Domestic Product (GDP)


GDP is the total market value of all goods and services produced within a country, reflecting its economic health.

A rising GDP often signifies a strong, growing economy, which can boost a nation’s currency due to investor confidence. Conversely, a declining GDP might signal economic trouble, potentially weakening the currency. For forex trading, GDP data can help identify long-term currency trends, particularly when compared across different nations.


Employment Data


Employment data is a major economic indicator with a substantial impact on currency values, particularly the Non-Farm Payrolls (NFP) data in the United States.

The NFP measures employment changes outside the farming sector, providing a snapshot of the U.S. job market. When job creation is strong, it suggests economic health, often strengthening the currency as investors and traders feel confident.

Weak employment figures can suggest economic issues, potentially leading to currency depreciation. Since employment is closely tied to consumer spending and economic stability, this data can be very valuable for traders.


Inflation Rates


Inflation, primarily measured by the Consumer Price Index (CPI), reflects the rate at which prices for goods and services increase.

Moderate inflation is generally healthy, indicating a growing economy. However, high inflation can devalue a currency as purchasing power declines. Central banks often adjust interest rates in response to inflation; if inflation is high, they may raise rates to control it, which can attract foreign investors seeking higher returns, thus strengthening the currency. Understanding inflation’s impact on interest rates and currency valuation is vital for forex traders.


Interest Rates


Interest rates are the cost of borrowing or the return on savings, set by central banks to regulate economic activity and influence currency value.

Interest rates are among the most influential economic indicators in forex. Central banks set these rates based on economic conditions, adjusting them to either stimulate or cool down the economy. Higher interest rates often attract foreign investment, increasing demand for the currency and boosting its value. Conversely, lower interest rates can make a currency less appealing to investors, leading to depreciation. For forex trading, interest rate changes and the policies of central banks (such as the Federal Reserve in the U.S. or the Reserve Bank of Australia) provide critical insights into likely currency movements.


Consumer Confidence Index (CCI)


The Consumer Confidence Index measures consumer sentiment and expectations regarding the economy.

High consumer confidence can indicate increased spending, which drives economic growth, while low confidence suggests economic uncertainty. CCI is considered a leading indicator, as consumer sentiment often precedes actual economic changes. When consumers feel positive about the economy, the currency may strengthen; when confidence drops, the currency may weaken. Forex traders use the CCI to anticipate changes in spending behaviour and overall economic direction.


Interpreting Economic Indicators


In forex trading, interpreting economic indicators requires understanding both individual data points and the relationships between them. Economic indicators can influence currency values in varying degrees, with some holding more weight than others. Traders must also consider correlations, as indicators like GDP and employment data often move together, giving a clearer picture of economic health.

One challenge traders face is managing contradictory signals. For example, strong employment data may suggest a strong currency, but if inflation is simultaneously high, it could lead to fiscal and monetary policy changes, ultimately impacting the currency differently. Weighing the significance of each indicator helps traders decide when to take action and which indicators align with their trading objectives.


Essential Economic Indicators and Practical Application


- For traders just starting with fundamental analysis, some economic indicators offer a straightforward approach to understanding market dynamics:

- Non-Farm Payrolls (NFP): Released monthly by the U.S. Bureau of Labor Statistics, NFP provides a quick look at employment trends, making it a critical indicator for traders.

- Consumer Price Index (CPI): CPI reflects inflation and purchasing power, directly influencing central bank policy and forex rates.

- Central Bank Interest Rate Decisions: Rate changes have immediate and often lasting impacts on currency valuation, making them a fundamental factor in forex trading.

You can find the details of every economic data event using our Economic Calendar.

Accessing timely and reliable economic data is crucial. Many traders use economic calendars, such as our one here, which provide release dates for upcoming economic data, allowing them to plan trades around these announcements. Economic calendars are invaluable tools for tracking data releases, setting alerts, and managing expectations for market volatility.

It's also important to be mindful of common misinterpretations, such as assuming that a single indicator will drive long-term trends. Forex markets are influenced by a multitude of factors, so it’s essential to view each indicator within a broader economic context.


Synergising Economic Indicators with Technical Analysis


Whilst economic indicators provide insights into a currency’s underlying strength, technical analysis offers real-time insights into price patterns and potential entry points. Combining fundamental and technical analysis enables traders to balance economic data with chart patterns, enhancing trade timing and precision. For instance, fundamental economic indicators can provide you with a long-term bias, and technical analysis can be used to find entries and exits in the direction of that bias.


Advanced Trading Techniques


Timing Your Trades


Timing is crucial when trading around economic data releases. Pre-release analysis allows traders to set expectations based on market consensus, whilst post-release strategies can help manage volatility once the data is out. Our Economic Calendar is an indispensable resource in this regard, assisting you in aligning trades with significant data releases and prepare for potential shifts.


Integrating Indicators into Your Trading Strategy


Developing a comprehensive trading strategy involves diversifying currency pairs based on each currency’s economic indicators. For instance, trading a U.S.-based currency pair based on NFP data, while trading an Australian pair based on the RBA’s interest rate decisions, can provide a balanced approach. Incorporating adaptive risk management around key data release dates can help traders mitigate the risks associated with high-impact news events.


Conclusion


Economic indicators are invaluable resources for forex traders, offering insights that can guide trading strategies and improve profitability. By understanding these economic indicators, you can better anticipate currency movements and make informed decisions. However, mastering these indicators requires continuous learning and constant observation.

Ultimately, leveraging economic data within a broader market analysis framework supports responsible trading practices and provides you with an additional source of information to make better trading decisions.


Remember: Successful forex trading requires a balance of economic insight, technical skill, and disciplined risk management. Stay informed, practice consistently, and adapt your strategies to ever-changing market conditions.

07/01/2025
Ready to Start Trading?
Get started live or get a free demo