Learn
What is Slippage?
Video Transcript
What do we mean by Slippage?
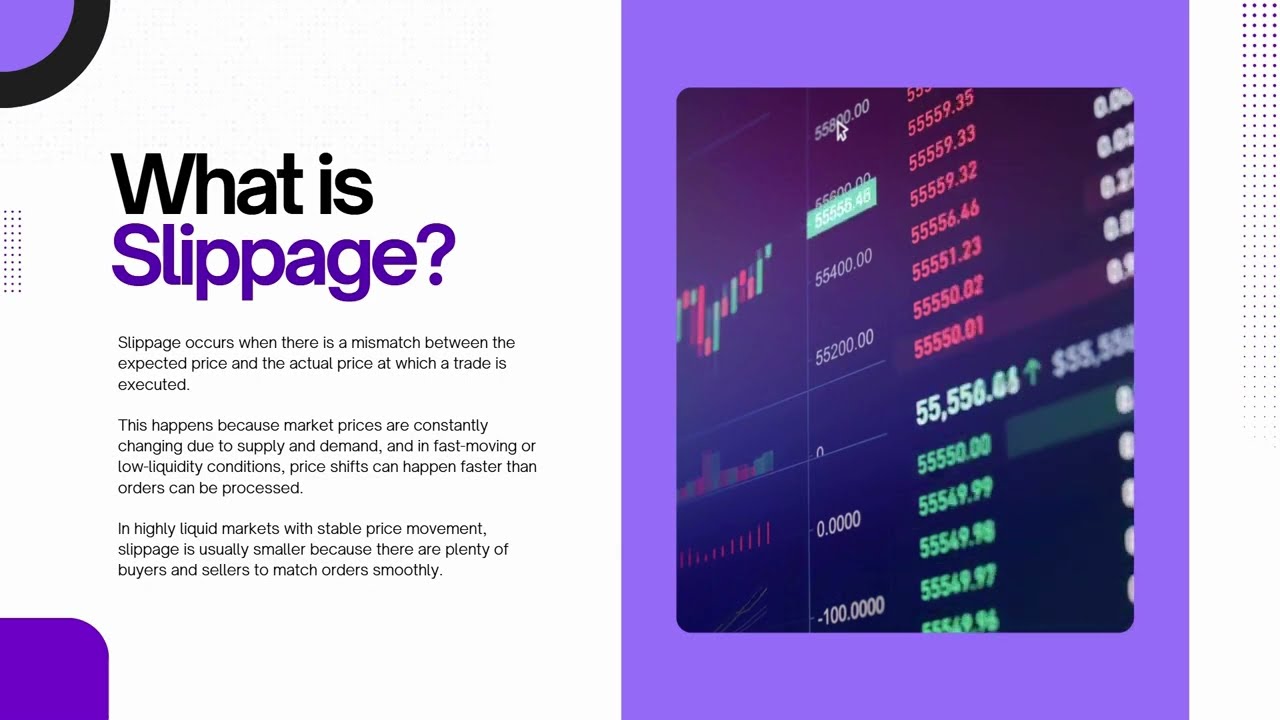
Slippage occurs when there is a mismatch between the expected price and the actual price at which a trade is executed. This happens because market prices are constantly changing due to supply and demand, and in fast-moving or low-liquidity conditions, price shifts can happen faster than orders can be processed. In highly liquid markets with stable price movement, slippage is usually smaller because there are plenty of buyers and sellers to match orders smoothly. But in volatile or very illiquid markets, prices can jump between order placement and execution quite erratically, leading to a different fill price than expected. This means that when you place an order, your trade might be executed at the next available price, which could be higher, lower, or the same as the price you intended.
Let’s do a quick explanation of how this works. This is a chart of gold. Now imagine for a second you wanted to buy gold, but your are trading at the same time that some very important US economic data is being released. Now imagine you press the buy button just as the US news comes out, and immediately within a few split seconds price gaps higher as market volatility ramps up due to the news event. This awkward gap in price is what we call slippage or price gaps. Because price jumped or gapped higher within a few milliseconds of the news release, it means that your buy order that would have been filled at 3203, will now only be filled or executed at the new available price, which is 3216. This is a good example of why trading products with higher liquidity is preferred by many traders, because it limits the amount of slippage a trader might experience.
The other benefit of higher liquidity is overall Price Stability. High liquidity means prices move more gradually and predictably, whereas illiquid markets can see wild price swings. In other words, lower liquidity leads to more erratic price behaviour or more volatility. These two charts is a great way to visualize this. On the left, we have the EURUSD currency pair on a 5-minute chart, and on the right we have the EURNOK currency pair on the right. Both charts are 5-minute charts, both pairs include the EUR, and both of them is showing price action for the exact same day and session. But look at how different both of these two markets traded. The EURUSD on the left saw gradual price moves throughout the session, with smaller candles and far less volatility. The EURNOK on the right on the other hand, looks like a total mess with huge spikes, no clear direction and just a huge amount of unwanted volatility in price behaviour. This chart is a really good example of why liquidity matters when choosing the symbols or assets you want to trade.
Relevant videos