Fusion Markets

Welcome to our Blog

Every so often, we post articles we think you might find useful and will help you grow as a trader.

All Categories
Trading and Brokerage
Market Analysis
General
Beginners
Market Hours
All Categories
All Categories
Trading and Brokerage
Market Analysis
General
Beginners
Market Hours
Loading...
No results
Trading and Brokerage
post image main
How to Trade on TradingView

For those familiar with the trading landscape, you’re probably already well aware of  TradingView. Founded in 2011 by brothers Stan and Constantin Bokov, this widely recognised platform was created with the aim of being an all-in-one platform for traders to connect, share ideas and learn from each other. Today, it is one of the most widely used trading sites on the internet - with over 50 million users worldwide. 


Now, picture this: Trading on the advanced charts on TradingView at some of the lowest costs available on the market. Sounds exciting, doesn’t it? By connecting your TradingView account with your Fusion Markets account, you now can. At Fusion, our mission has always been about making trading accessible to everyone by offer radically low costs and no hidden fees or catches. That’s why we’ve partnered with TradingView to make low trading at the highest quality even more accessible.  


This article will delve into what TradingView is, its key features, and a step-by-step guide on how to effectively trade on the platform. 


Contents


Getting Started

Navigating the TradingView Interface

Trading on TradingView

Managing Positions and Live Trades on TradingView

TradingView Strategies

Conclusion


Getting Started


Before you dive into the world of trading on TradingView, you'll need to set up an account. Here's how to get started: 


  1. Account Creation: go to tradingview.com and sign up for a free or paid account. The free version offers a wide range of features, while the subscription provides additional perks, such as more alerts, indicators, and the ability to use multiple charts. 
  2. Personalising Your Profile: Customise your profile by adding a profile picture and filling out your bio. This can help you connect with other traders on the platform and share your insights. 
  3. Selecting a Subscription: If you decide to upgrade, choose the plan that suits your needs best. You can compare the available plans on TradingView's website. 


You will also need to create a Fusion Markets’ account or login to the existing one. If you struggle with selecting whether to sign up for a Classic or Zero account, visit our Accounts Overview page. 

Once it is done, here’s what you have to do next: 


  1. Go back to tradingview.com and open a chart that you want to start trading from. 
  2. Click on Trading Panel at the bottom and choose Fusion Markets;  
  3. Select your account type and click on ‘Continue;  
  4. Log in using your Fusion Markets account;  
  5. Tick the accounts that you wish to use and click on Allow when finished. 


You are all set!  


Navigating the TradingView Interface


After setting up your account, the next step is to familiarise yourself with the TradingView platform. The platform is intuitive and straightforward to navigate, with a wide range of features and tools neatly organised for ease of use. 


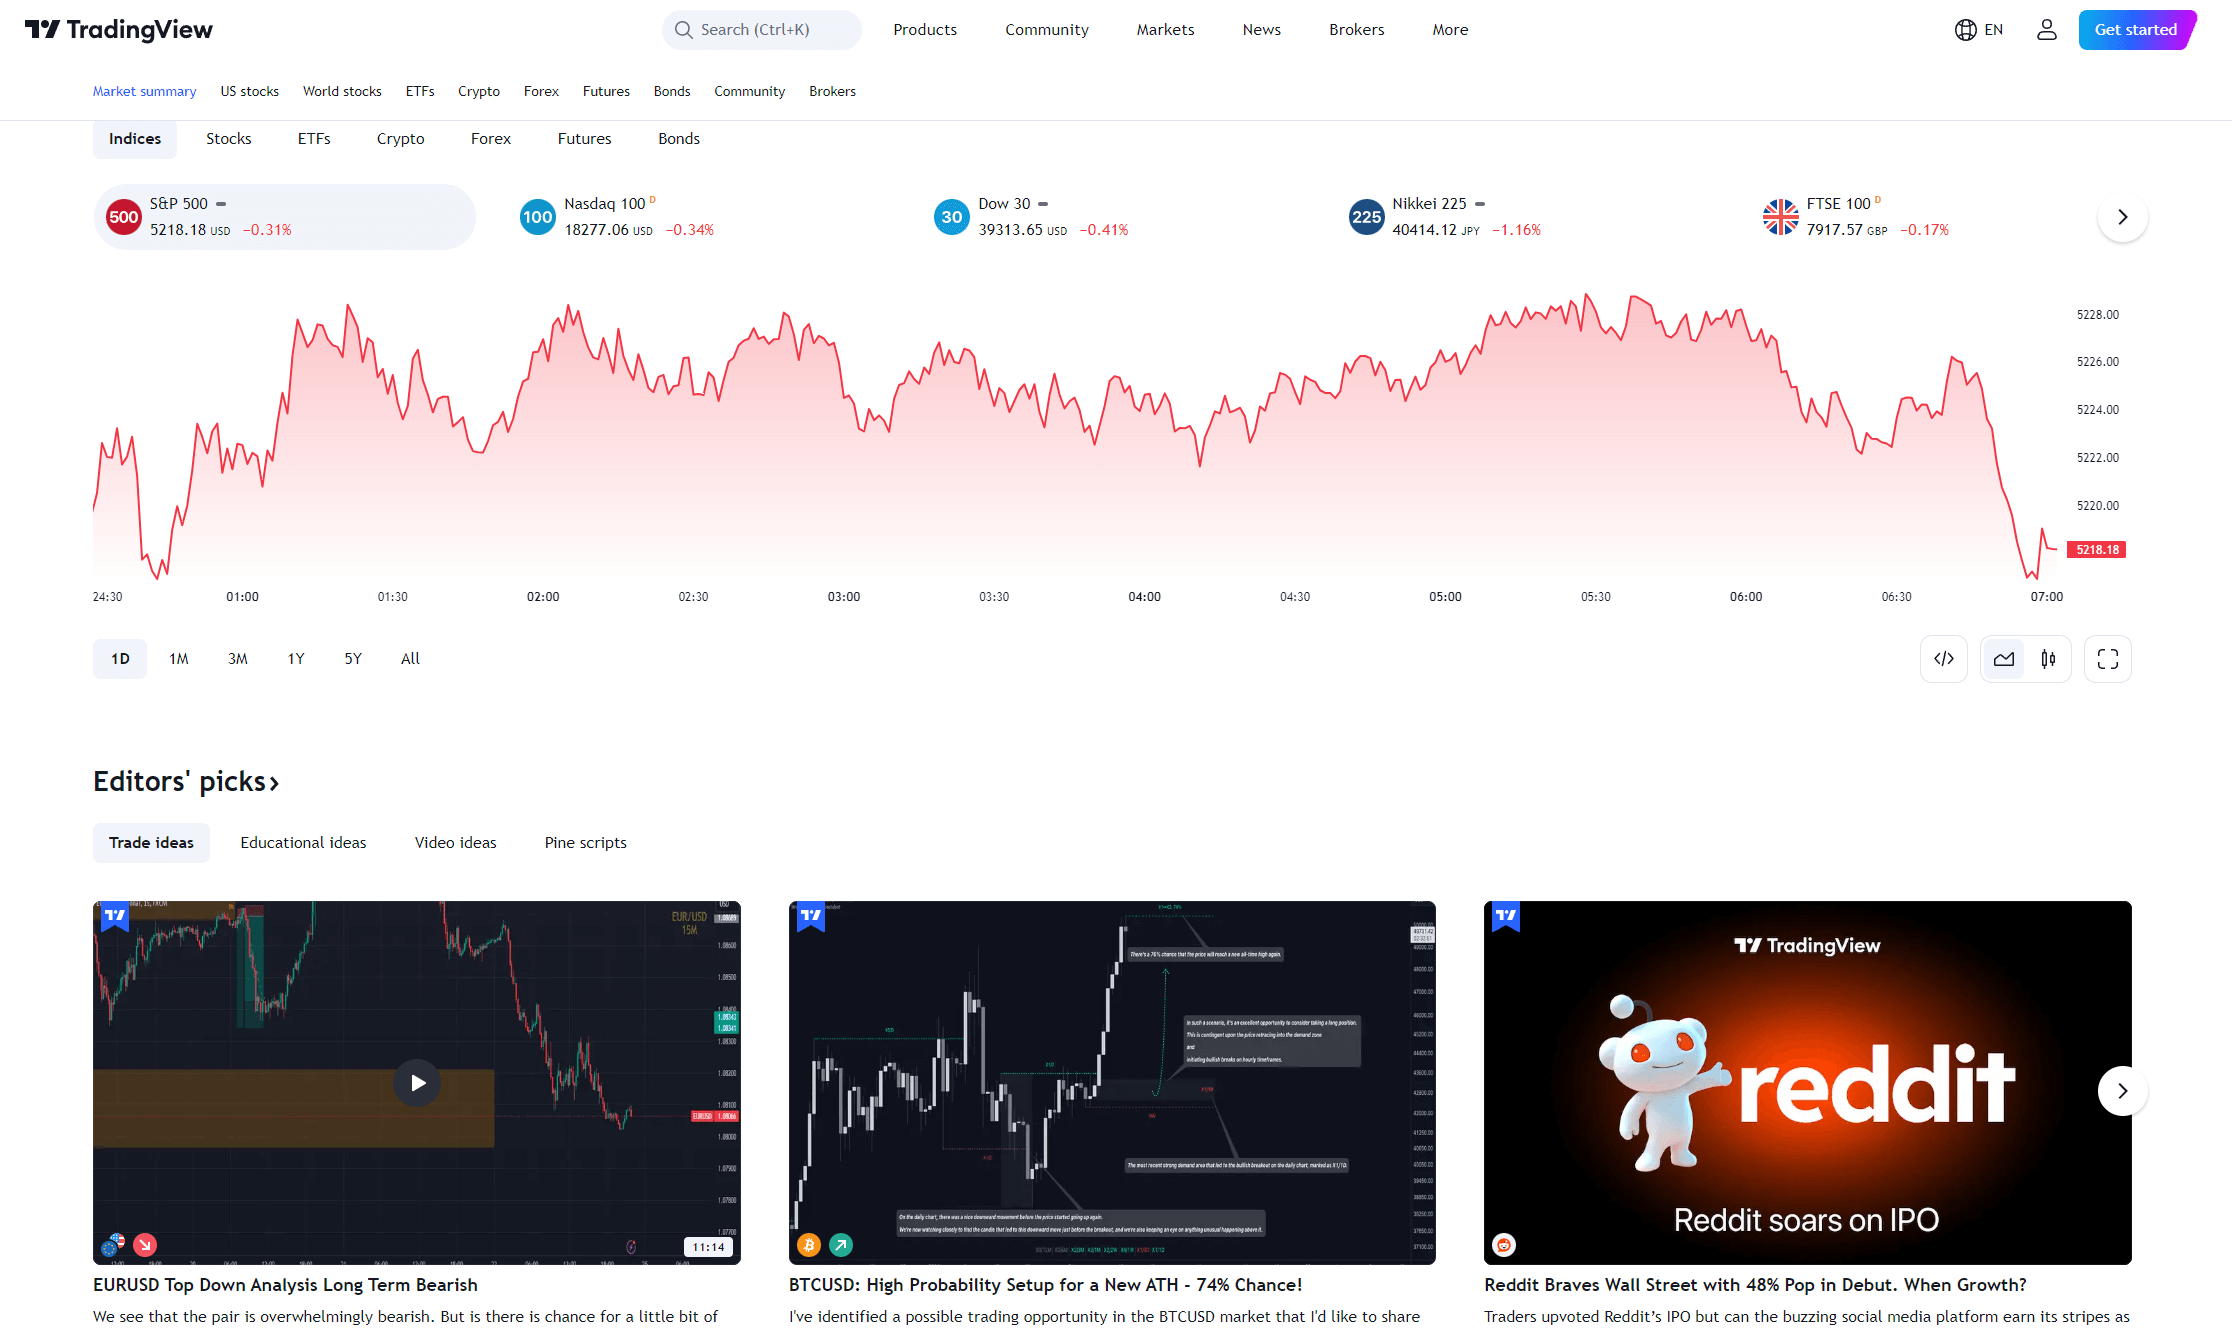
Homepage Overview: The homepage provides an overview of the financial markets. On the right-hand side, you'll find the news feed, watchlist, and trading panel. 


You can customise it by adding watchlists and widgets for specific assets or markets you're interested in. 


TradingView_Homepage


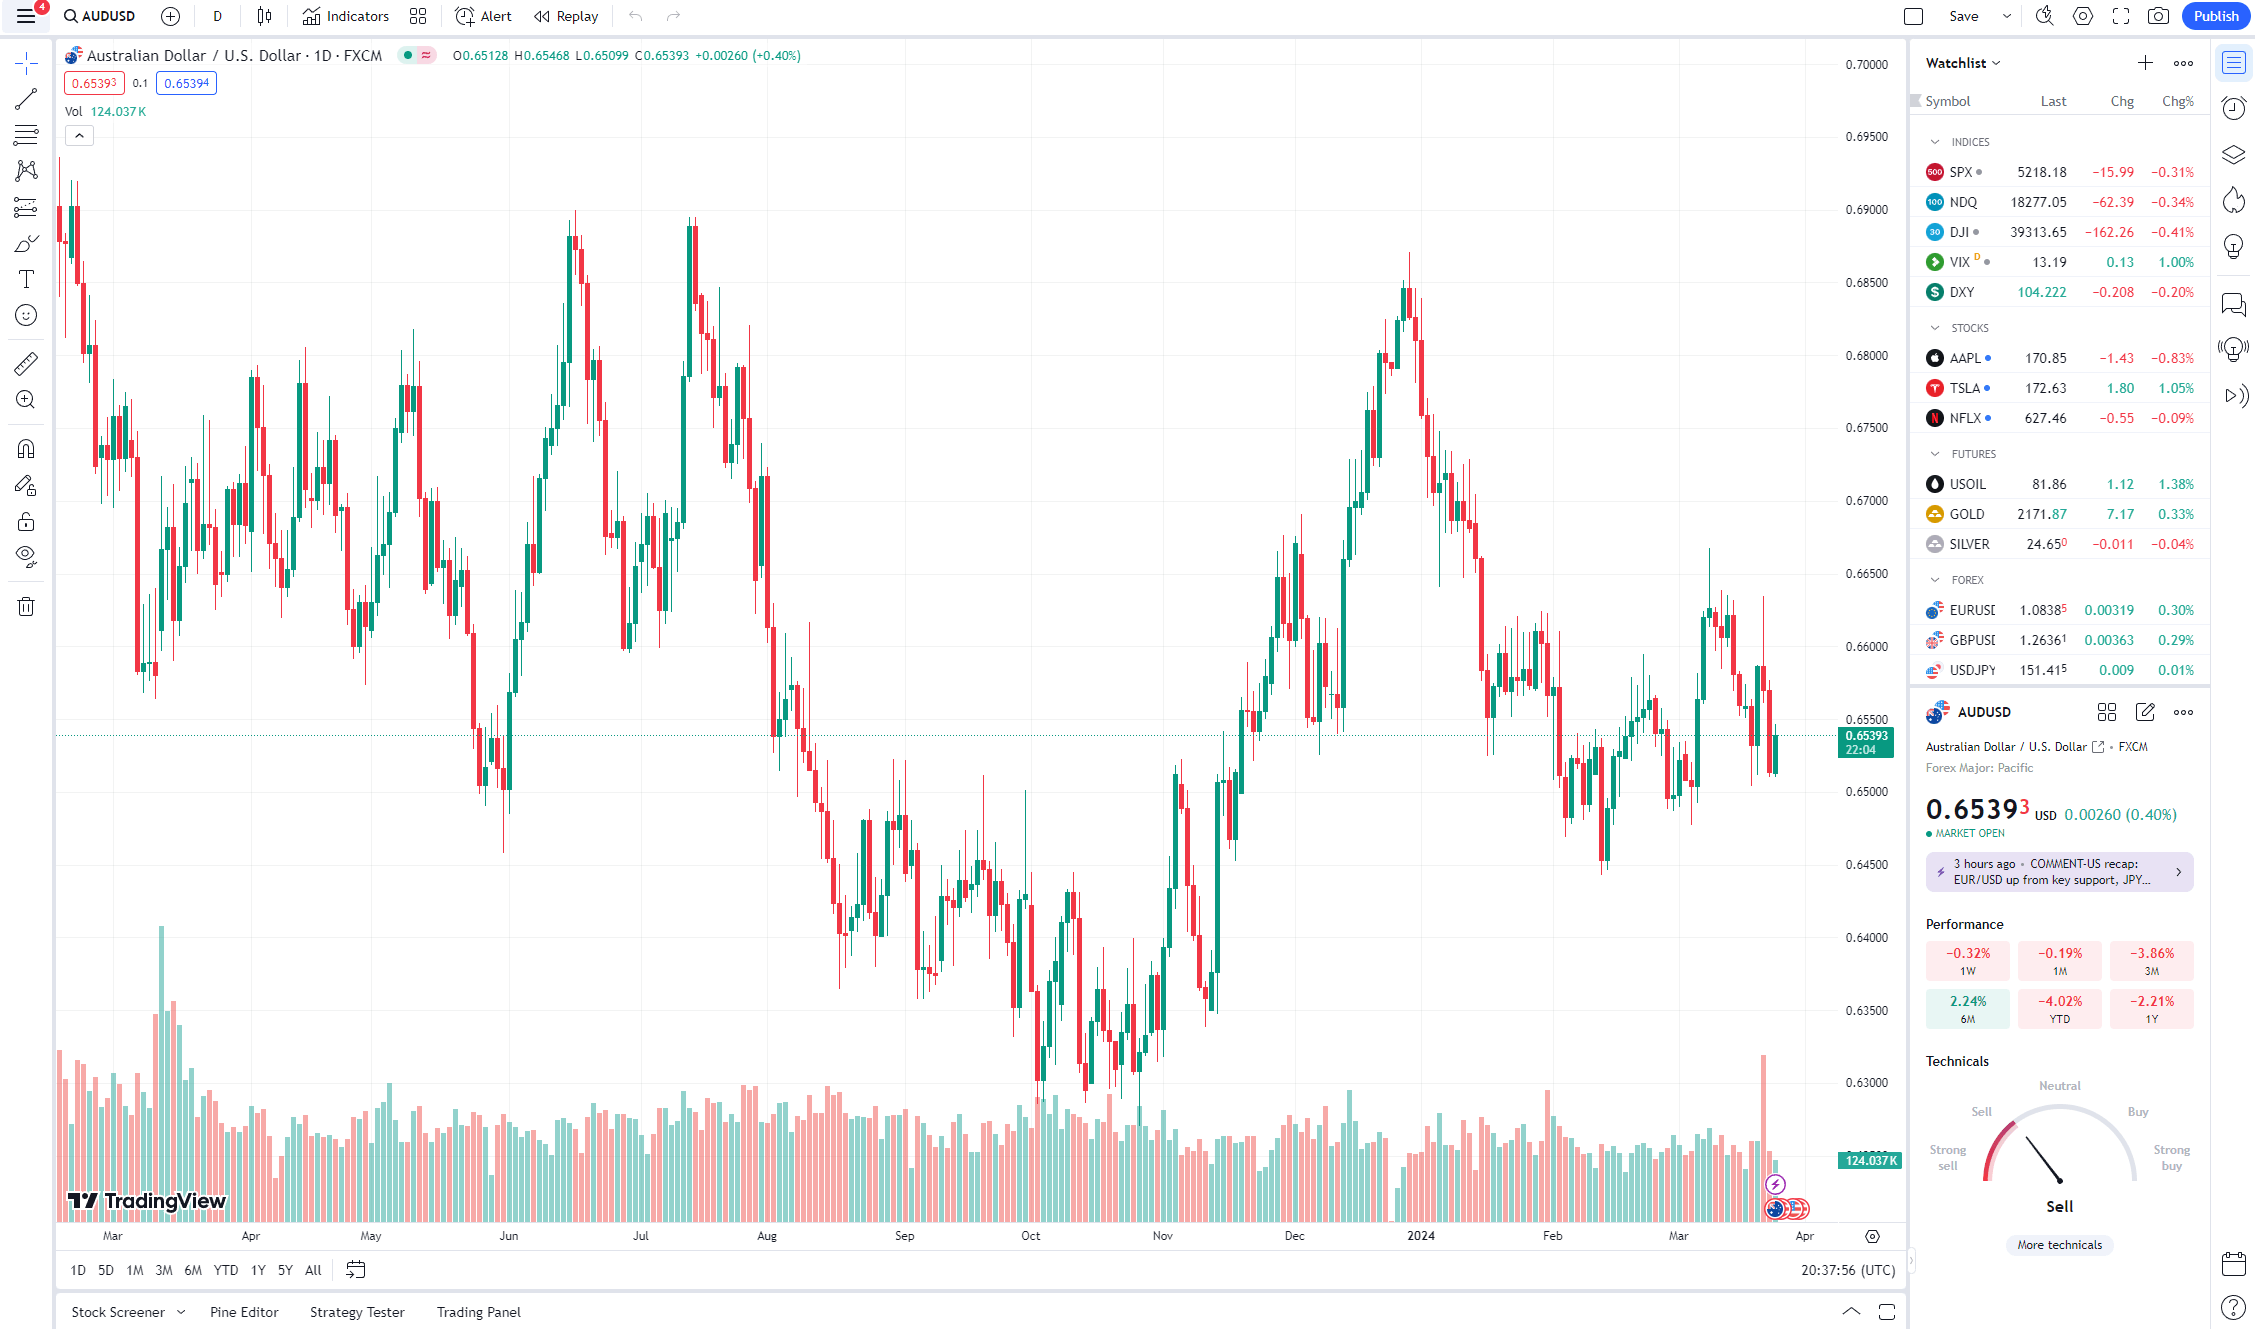
Charting: TradingView offers a wide range of technical indicators, drawing tools, and chart types. The platform offers flexibility in setting candle time frames, ranging from one second to one year. Indicators can be chosen from a drop-down list located in the top toolbar. For additional analysis such as annotation, measuring tools, and trendlines, the platform provides over 90 drawing tools accessible from the toolbar on the left-hand side of the chart.  

AUDUSD

The TradingView platform facilitates the analysis of market data through a variety of chart types, conventionally categorised into two groups. 


The first category consists of traditional charts, constructed based on time, including: 


  • Bars 

  • Candles 

  • Hollow candles 

  • Columns 

  • Line 

  • Line with markers 

  • Step line 

  • Area 

  • Baseline 

  • High-low 


The second category comprises charts constructed solely based on price changes, such as: 


  • Heikin Ashi 

  • Renko 

  • Line break 

  • Kagi 

  • Point & figure 

  • Range 


Users can easily select their preferred chart type from the drop-down menu located on the top toolbar. 


TradingView_Charts


Indicators: TradingView offers a robust selection of over 100 indicators. You can add these to your charts to analyse price movements, trends, and other essential data. Popular indicators include Moving Averages, Relative Strength Index (RSI), and Bollinger Bands. Additionally, users have the flexibility to craft custom indicators in JavaScript through the platform's API. This API empowers users to design a diverse range of indicators, incorporating various plot types, styles, colours, and mathematical functions. 


Within the user interface, individuals can seamlessly integrate custom indicators onto the chart. Adjustments to specific indicator parameters can be made using the dedicated Indicators and Settings dialog. It's important to note that while users can add custom indicators and modify certain parameters through the UI, the platform does not allow the creation of entirely new indicators or the modification of existing code for pre-existing ones. 


Alerts: TradingView alerts provide instantaneous notifications when the market aligns with your personalised criteria. For instance, you can set an alert such as, "Notify me if Tesla surpasses $250." All users have access to various notification options, including visual pop-ups, audio signals, email alerts, email-to-SMS alerts, and PUSH notifications directly sent to your mobile device. 


You can also set alerts on indicators, strategies, and drawing tools and even customise your trigger settings. 


TradingView_Indicators


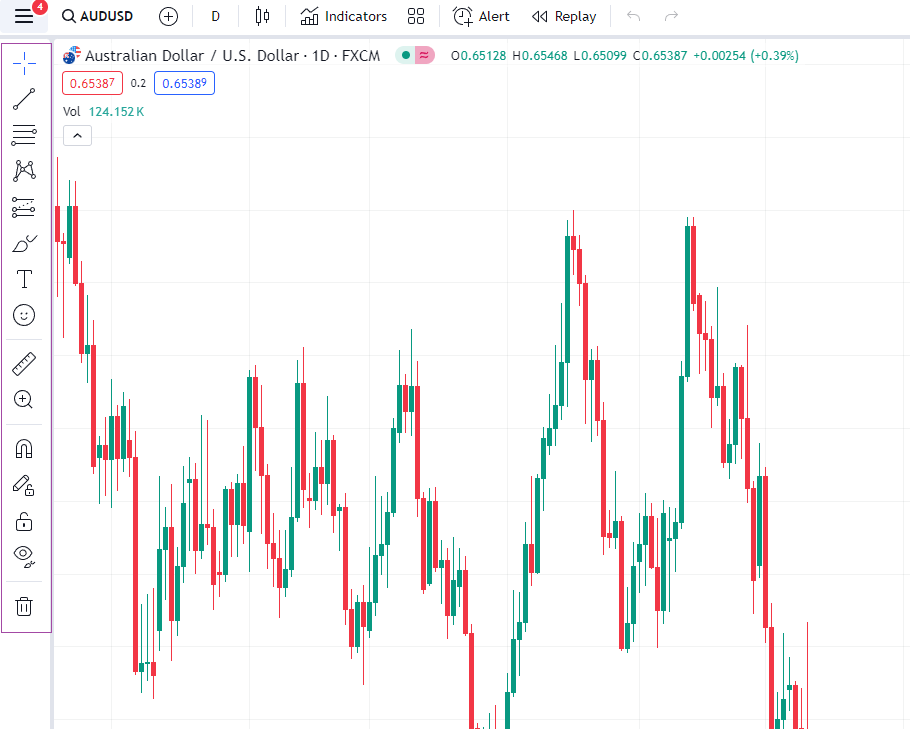
Drawing Tools: TradingView's drawing tools offer a versatile range of functionalities, allowing users to make annotations, insert comments, highlight trends and patterns, conduct measurements and forecasts, and calculate price levels. These tools are conveniently positioned on the left panel of the chart, providing easy access for users to enhance their analytical capabilities and visually communicate insights. Whether you need to jot down notes, emphasise specific points, or perform detailed analyses, TradingView's drawing tools allow users to interactively engage with charts and convey valuable information effectively. 


TradingView_Drawing_tools


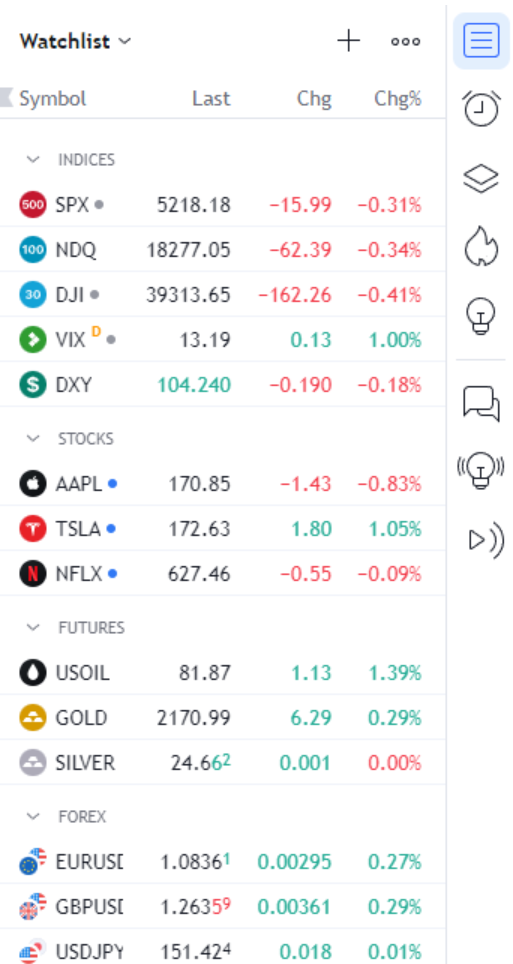
Watchlists: Watchlists are located on the right side of the screen. You can create a new watchlist by clicking on ‘Create new list' or import the existing one to keep track of your favourite assets. Please note that the import option is only available for Pro accounts. To add assets to your watchlist, click on the '+’ or ‘X’ if you wish to remove it. 


TradingView_watchlist


Social Features: The ability to publish and share your trading ideas is a pivotal feature, facilitating collaborative learning. You can exchange trade-related information or engage in discussions about current market conditions with fellow traders who share your level of experience or interact with more seasoned traders.  


For a dose of inspiration, navigate to the "Community" section in the header menu and select 'Trade Ideas.' Here, you have the option to explore trade ideas by specific assets, follow the curated selections from editors, or delve into the trending ideas on the platform. 


TradingView_community


Every member of the community has a badge. Let’s go through them one by one: 


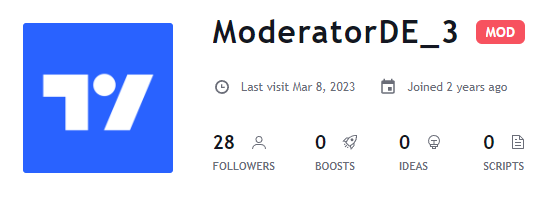
  • MOD - The red MOD badge is assigned to TradingView moderators, distinguishing them within the community. This badge serves as an additional layer of security for all members, enabling easy identification of moderators. In case you have inquiries or require assistance, this badge helps you discern who is a moderator and who isn't. 


moderator_badge


  • The BROKER badge, available in blue (platinum), gold, or silver, is designated for broker accounts on TradingView. Members adorned with this badge are exclusively recognised as official broker representatives. The broker page offers comprehensive details on Terms of Use and reviews from live-account owners. 


  • WIZARD - The green WIZARD badge is awarded to Pine Script™ Wizards, who are exceptional programmers proficient in Pine Script™—the language employed for developing indicators and strategies on TradingView. These Wizards make noteworthy contributions to the community by assisting numerous traders with their code-related queries. Read our blog to learn how to use PineScript for trading on TradingView.


  • TradingView official accounts, along with badges for TradingView employees, feature a distinctive blue badge adorned with a TV logo. This badge serves as a visual identifier to distinguish and authenticate the official presence of TradingView and its staff within the community. 


The conversations unfold in real time, allowing you to connect with individuals trading the same instruments as you. You can share links to your charts, articulate your trading concepts, and receive feedback and comments to foster mutual growth and prosperity in the trading community. The overarching goal is to enhance your trading and investing skills by gaining insights from the actions of others.  


Trading on TradingView


Understanding how to correctly place trades on TradingView is crucial. One of its standout features is Pine Script, a domain-specific programming language that allows users to create custom indicators, strategies, and scripts. Visit our blog [LINK] to learn how you can leverage PineScript for trading on TradingView. 


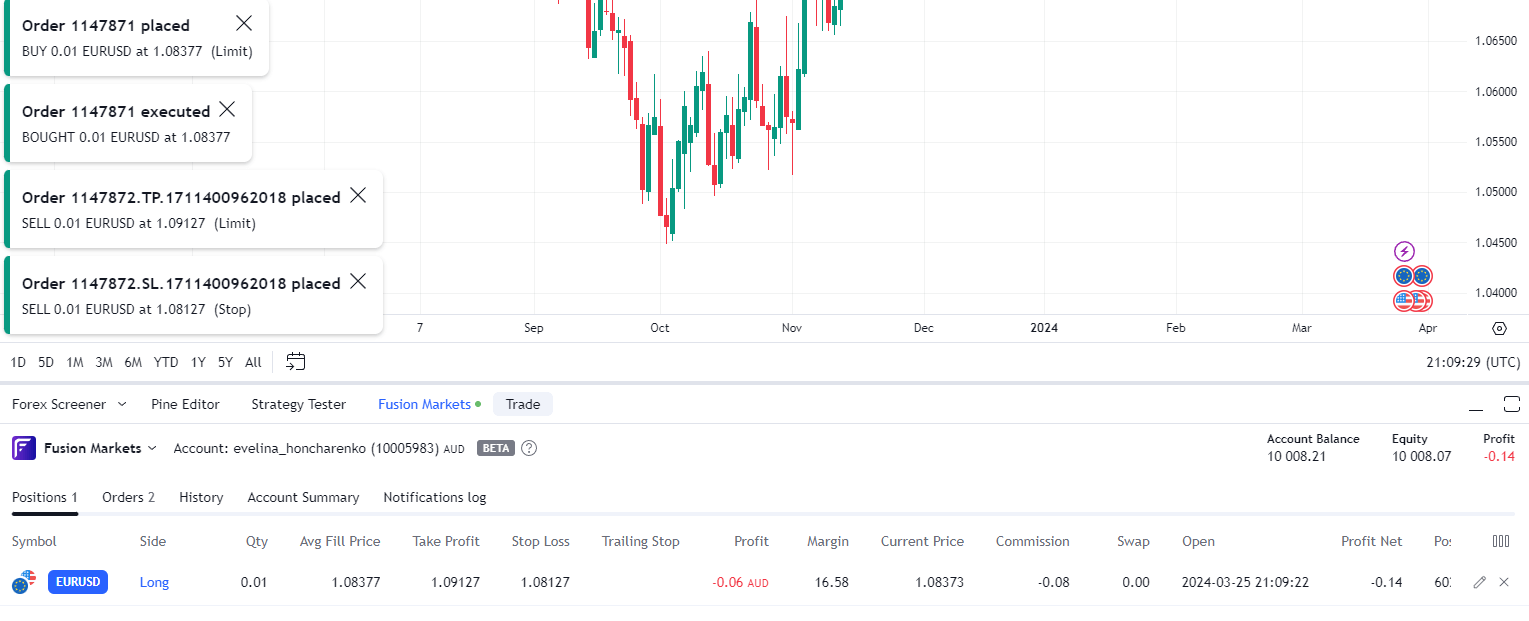
Once you have logged into your trading account, you'll notice four tabs at the bottom: Positions, Orders, Account Summary, and Notifications log. The Orders tab conveniently provides a filter for all possible order statuses. Each column in the Orders tab displays key values from the Account Summary, represented by a grey line. 


At the top-right of the Trading Panel, you'll find a menu containing main settings for trading, a button for disconnecting trading, and an option for selecting another broker. Your account ID is prominently displayed, and if it's a multi-account ID, a dropdown allows you to switch between sub-accounts.


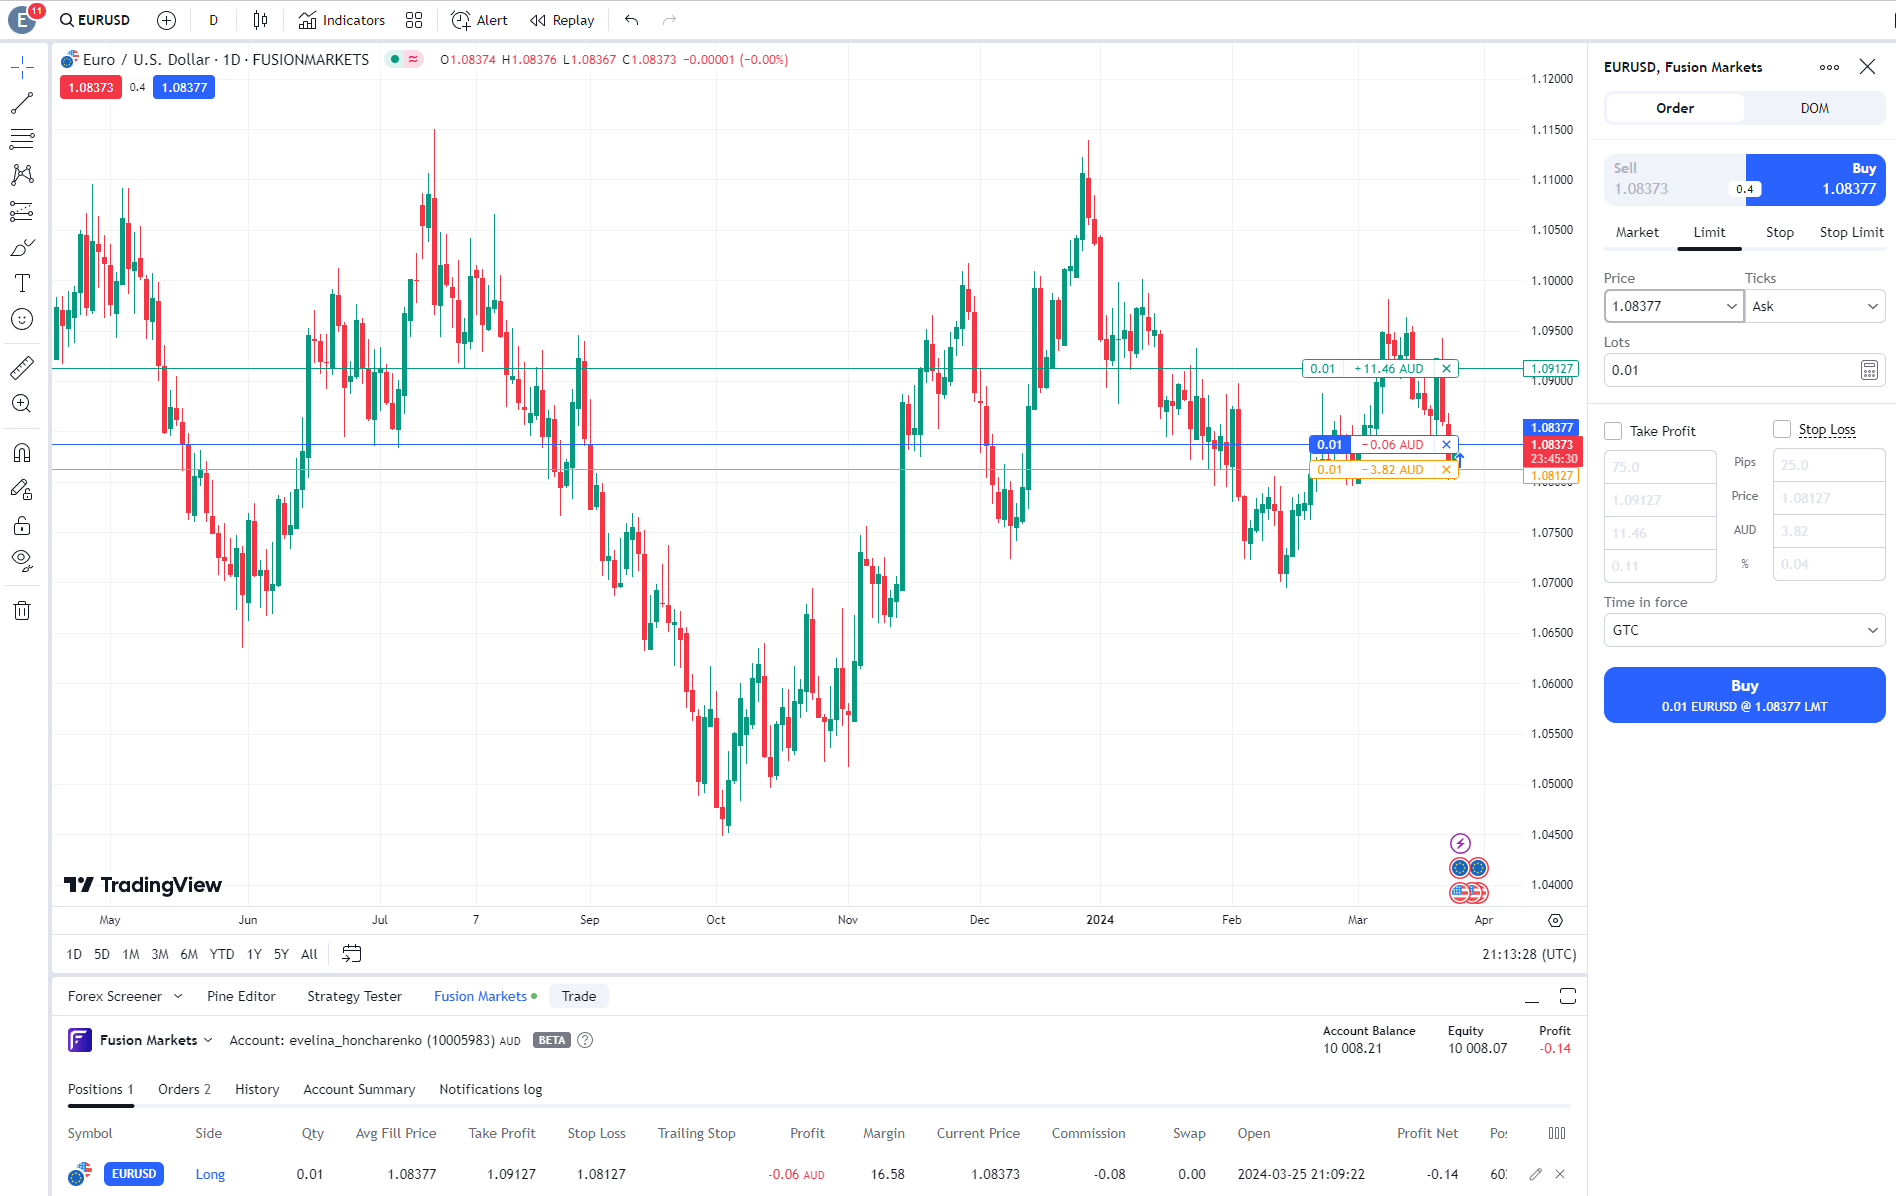
To place an order, you have several options. You can do so through the context menu on the chart or trading panel, the Plus menu on the chart, or by using the Buy/Sell buttons. The easiest way is to click on ‘Trade’ on the trading panel, and a new window will pop up.  


EURUSD Chart

When accessing your TradingView execution platform, the Buy/Sell buttons are prominently displayed directly on your chart. In the chart's centre, the market spread is visible, and on the right, you have the option to adjust the number of contracts. Initiating a Buy or Sell order opens the order execution window. 


order_window_TradingView


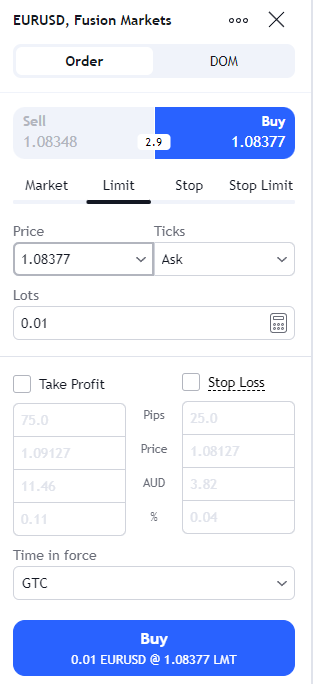
Order Placement: Upon clicking Buy or Sell, you initiate the opening of the execution window and gain the ability to adjust the parameters of your trade before finalising the execution. Let's guide you through each parameter individually: 


  • Account: If you have multiple accounts, you can seamlessly switch between them at this point. 

  • Side: Indicate whether your order is a buy or a sell order. 

  • Type: Select from the following order types: Market, Limit, Stop, or Stop Limit.  

    • Limit: This order triggers when the price reaches the specified limit or a better price. Note that in situations of imbalance between buyers and sellers, limit orders may not be immediately filled. 

    • Market: This order gets filled immediately at the best available current price. 

    • Stop: A stop order that converts into a market order once the specified price is reached. 

    • Stop Limit: Similar to a stop order, this type converts into a limit order after the specified price is hit. 

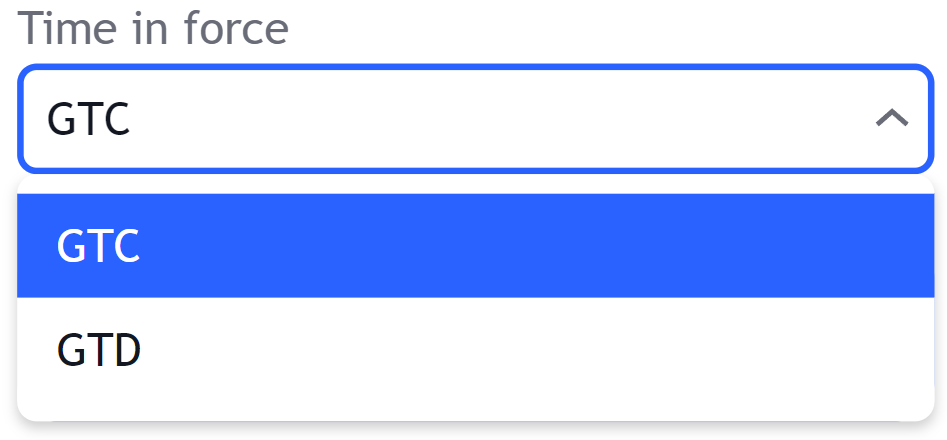
  • Duration: You have the flexibility to specify the duration of your order, and TradingView offers various options: 
  • GTC (Good Till Cancelled): The order persists and stays open until explicitly cancelled by the trader. 
  • GTD (Good Till Day): The order remains active until the specified date set by the trader.


time_in_force


  • Symbol: You can modify the symbol (market) at this point. 

  • Quantity: Adjust the quantity of contracts you wish to buy or sell. 


Managing Positions and Live Trades on TradingView


After executing a trade, the details of the trade become visible on your chart. TradingView displays the current Profit/Loss and the quantity of your position. 


Additionally, it provides options to reverse your trade, converting a buy trade into a sell trade, or to close your position with a single click. In the Trading Plan section at the bottom of the screen, you can monitor your current positions under "Positions" and access all your active trades with supplementary data. Closing positions can also be done conveniently using the X icon located on the right. 

 
When you enable the visualisation of past trades on TradingView, the platform will display red and green arrows directly on your charts, indicating the entry and exit points of previous positions. 


Moreover, you have the capability to view the number of contracts traded, accompanied by the execution date, providing a comprehensive overview of your trading history. 


TradingView_Strategies


One of the attractions for millions of retail traders to this platform is the assortment of specialised tools and user-generated strategies available for utilisation at any given time.  


Our immediate focus is on understanding how to employ strategies. Without delving into the intricacies of each strategy, let's elucidate how to leverage TradingView using a range of pre-established strategies conveniently accessible on the website. 


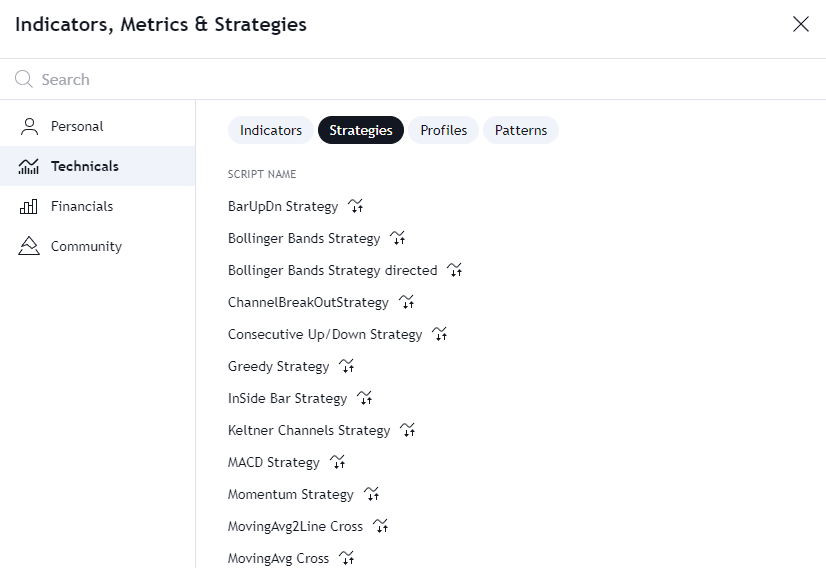
Follow this simplified step-by-step guide: 


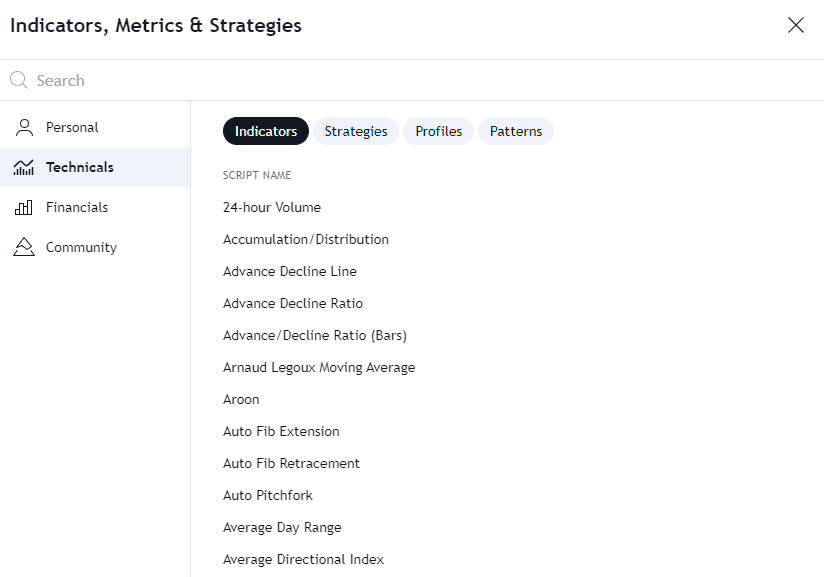
  • Click on "Indicators" in the topmost menu of the TradingView terminal. 

  • Opt for "Strategies" from the tabs positioned above the list of indicators. 

  • Select the desired strategy from the new list provided. 


If you cannot find the strategy you're looking for, use the search bar for a quick and efficient search. 


TradingView_Strategies


It's as straightforward as that. As soon as you select a specific strategy, you will see its implementation on the price chart. Additionally, it's essential to understand how to employ multiple charts in TradingView. Some strategies may necessitate cross-comparisons with price data from other assets. 


To achieve this, simply click the plus icon next to the name of the primary viewed asset and choose the required asset from the list or use the search feature. This action will promptly overlay one chart over another, offering a more comprehensive view of the price in the context of its comparison against other assets. This feature proves particularly useful when dealing with futures and other derivatives. 


Conclusion 


Trading on TradingView is a dynamic and multifaceted process that combines technical analysis, strategy development, and community engagement. To succeed, you'll need to continually refine your skills, adapt to changing market conditions, and maintain a disciplined approach to risk management. 


Remember, no trading platform, no matter how sophisticated, can guarantee success. It's up to you to apply the knowledge and tools provided by TradingView to make informed decisions and build a profitable trading career. Whether you're a seasoned trader or just starting, TradingView can be a valuable resource on your journey to financial success in the world of trading. 


26/03/2024
General
post image main
Leverage: the 9th wonder of the world?

Read Time: 14 Minutes.

Albert Einstein was once asked what the most powerful force in the universe was. After a thoughtful pause and not without a sense of humour, he replied that it was compound interest, which he would later describe as being the world's eighth wonder.


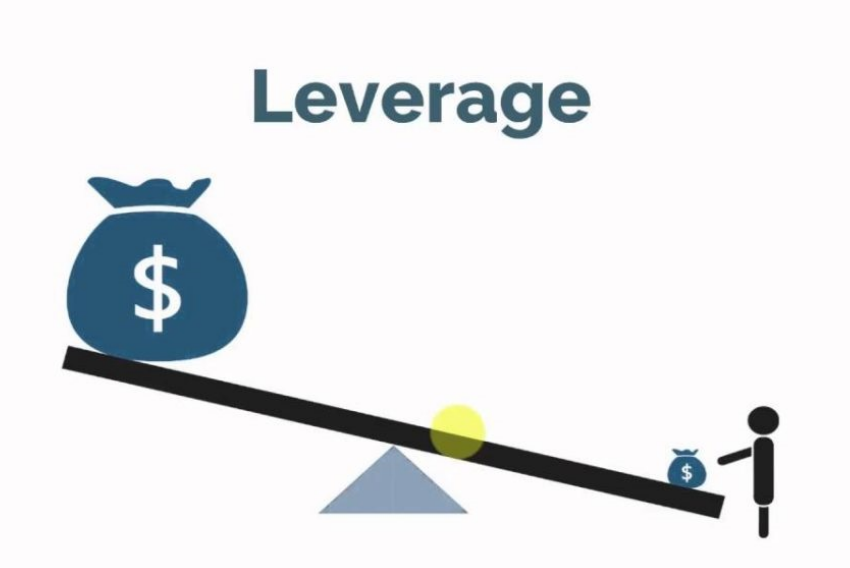
If we were looking for a candidate to fill the number nine spot on that list, we could easily pick another innovation from the world of finance; leverage.


If we look at a dictionary definition for the term, we find the following.


"The use of credit to enhance one's speculative capacity"


The concept of financial leverage is probably most familiar to us in a mortgage loan, a loan secured against a property.


To secure a mortgage, it’s normal for the buyer or buyers of the property to put down a deposit that acts as their “skin in the game”.


A bank or other lender finances the purchase price balance through a loan that runs over a fixed term, usually measured in 25-30 years.


This is made at a known or referenced rate of interest, which may be fixed or variable over the loan term. For example, the rate may be set at central bank base rates +X%.


The buyer of the property finances the loan through the payment of interest, which compounds over time to make the lender a healthy return on their loan, assuming all goes well.


The ever-present longevity of a mortgage and the nature of its commitment can be summed up through a literal translation of the word mortgage from the French, where it means “death pledge”.


Of course, that rather sombre definition only looks at the liability side of the transaction. It doesn’t take into account the opposite side of the coin, and that is the asset that the mortgage is taken out over.


All things being equal, the asset will have appreciated over the lifetime of the loan. And in modern times, it will have often done so to such an extent that its value now exceeds the loan's original value.


Under those circumstances, the death grip is loosened and may even be released completely if the property’s owners choose to sell it and repay the outstanding mortgage balance.


That’s all very interesting, but what has any of this got to do with trading and investing?


Well, just over 20 years ago, traders in London had the great idea to introduce leverage into OTC financial instruments such as CFDs and rolling spot FX.


This effectively democratised the availability of leverage in trading by providing it to the man in the street who could now gear up their trading account and speculate on the markets in a way that wasn’t possible before this point.


The availability of leverage in margin FX and CFD trading was a marketing team's dream. A whole new industry sprung up to offer these products (which had previously been the preserve of hedge funds) to retail traders.  


Eventually, competition for that business was such that brokers began to raise the levels of leverage that they offered to their customer base.


Put simply, that meant that traders could control an ever-larger parcel of stock, an equity index or FX pairs with a smaller and smaller deposit, which brings us to today.


It all sounds great. Because, of course, if your position was leveraged 500 times, then so was your P&L. A dollar profit became 500 dollars.


Well, not so fast because leverage is a two-way street that magnifies profits and losses.


And whilst leveraged positions in profits create equity in your account, leveraged positions that are in loss eat away at your account balance and ultimately undermine it completely.


Events in the spring of 2021 highlighted exactly why traders need to respect and control their use of leverage, and the consequences of not doing so could not be clearer.


Bill Hwang of Archegos Capital Management, a hedge fund turned family office with $20 billion in assets, effectively evaporated overnight thanks to a combination of risk concentration and excessive leverage.  


Put simply, the fund had too much money chasing too few positions.


You might have thought that having $20 billion to invest would mean that you wouldn’t need access to leverage, but Archegos Capitals strategy was to leverage that vast sum by as much as 7x times through a network of banks and brokers. The trick was that none of these banks knew just how much leverage the other parties had offered Archegos.


But no one, not even a hedge fund of that scale, is bigger than the markets, and when some of these positions fell in price and value, the fund’s brokers asked for additional margin to shore up its trading accounts.


By this stage, the banks were concerned about their own liabilities and whilst they were talking to each other about they should proceed, one or two of the banks started to try and close out the positions they held for the hedge fund.


Once word got out that this was happening, it became a free-for-all, and the stocks that Archegos held plummeted. And that, of course, created even larger margin calls that the fund had no hope of meeting.


Below is Archegos' biggest positions in their fund and how quickly things folded within a couple of days after the music stopped. ViacomCBS, a respected US media company, fell by over 50% in 2 trading sessions.


These events reinforced another lesson for traders - the one that says the end of the party is never pretty if everyone heads for the exit simultaneously.


It also reminded us of how an imbalance between supply and demand can influence prices (Gamestop or AMC, anyone?)


You probably haven’t got $20 billion, but you do have your nest egg and trading capital that you worked hard to build up. Please don’t blow it by leveraging and concentrating your risk in one or two big positions.


A disciplined approach to money management and risk is the key to successful trading and investing. When you don’t use that disciplined approach, it often goes horribly wrong, as the former Hedge Fund Archegos Capital found out.


17/06/2021
Market Analysis
post image main
Our Top Five Most Used Tools

Hi Traders,


By popular demand, we wanted to share our top five most used tools and features that are provided to you for free in our client area.


These are a bit like my Top Five Tools for Traders, but these are a little different as they're all internal rather than other websites or companies. 

Here are 5 of the most popular tools (in order) our clients are loving:

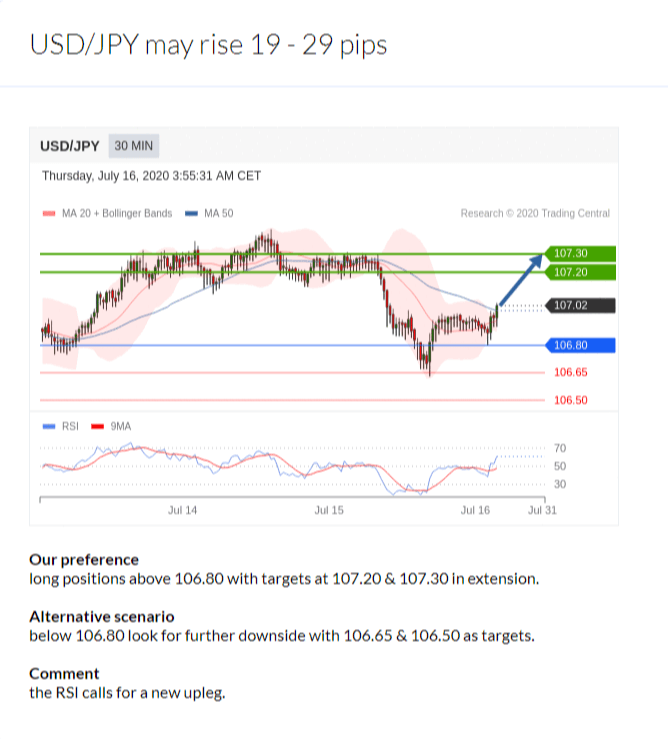
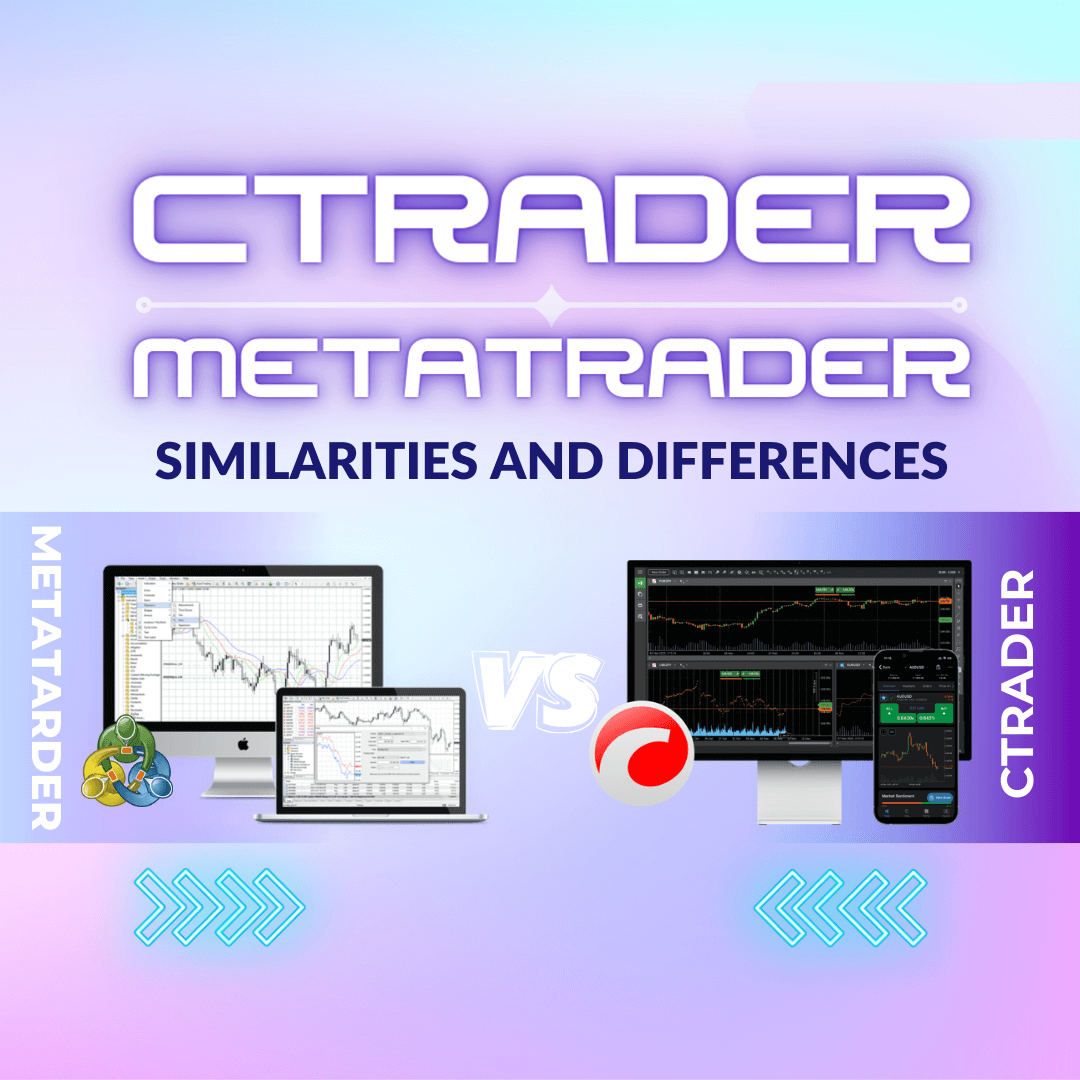
#1 - Analyst Views by Trading Central. This is my personal favourite. You can view it in the hub now, download it and use it as an indicator on MT4 desktop (in "Downloads on Hub) or visit your "News" tab in MT4 where it's constantly updated too.

#2 - The Economic Calendar is a must too. Are you using this already? If you're trading and don't know what announcements are coming up, you could easily be blown away by a big move and have no idea why. My favourite is that it will show you the historical price impact of previous announcements. You can even save the future events as a calendar invite!

#3 - News Tab - Knowledge is power. You know that already. You might already have your own news sources which are cool, but with Fusion's news tab, you can create a personalised feed (e.g. only show me EURUSD) or see what's most popular for others. Don't be an uninformed trader.

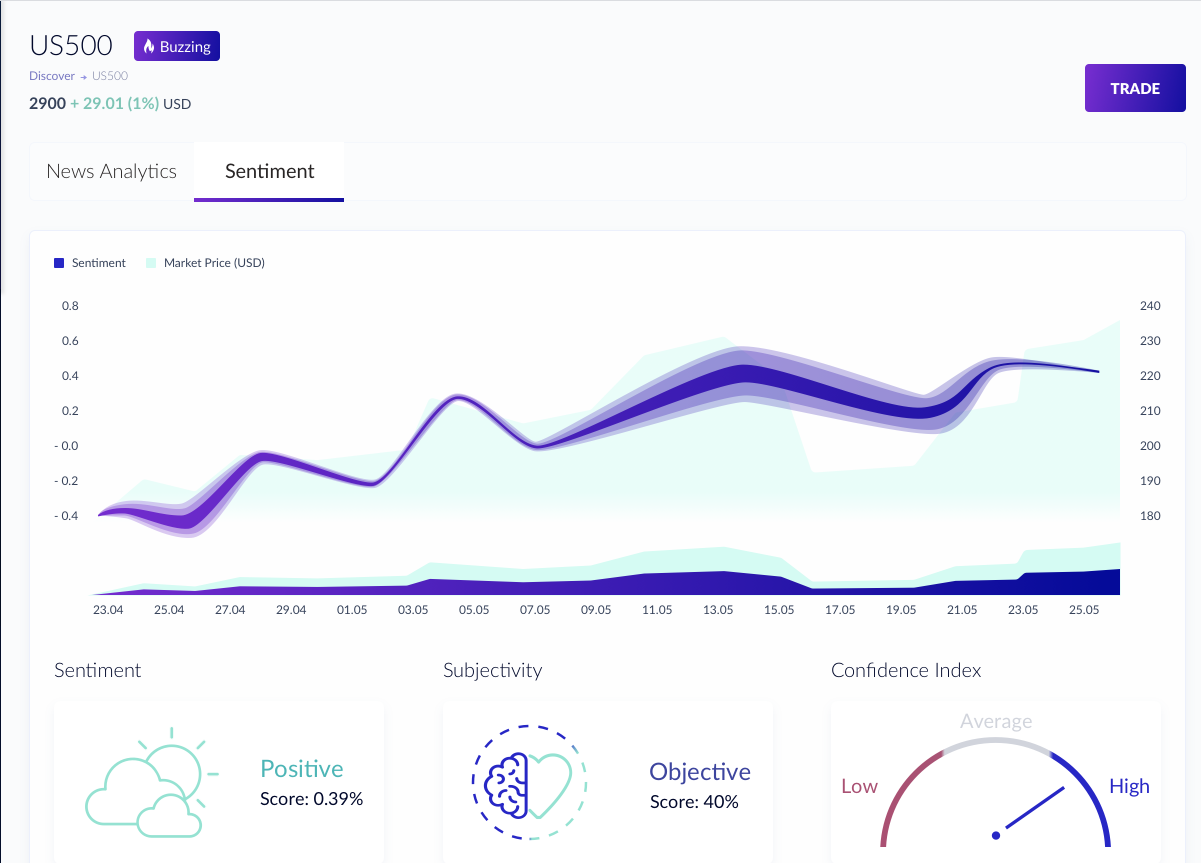
#4 - Sentiment - I love the idea of knowing what the crowd is bullish or bearish on. What are people talking about? Why are they talking about it? Check out our post on why this is important.

#5 - Technical insight is excellent if you'd like to go into a deeper dive on technical analysis on Forex and Indices. I prefer these charts over MT4 truth be told and want to know short, medium and long term outlook for each trade I'm considering.

That's it for now. We've built these for you and believe they'll truly help you excel as a trader.


#6 – Historical and Live Spreads Tool - with this tool, you can see how spreads have fluctuated over time, as well as the current live spreads. This information can be incredibly valuable in helping you make informed decisions about when to enter and exit trades. No more surprises, no more hidden fees – just transparent, competitive pricing. Read our blog post to learn how spreads actually affect your trading costs. 


To start using these tools now, create a Fusion account.

14/07/2020
Trading and Brokerage
post image main
Getting Sentimental

We believe that wherever possible, we should remove emotions from our trading psychology and try to act logically and systematically when making trading decisions. That’s because there are facets of our emotional selves that are just no good when it comes to making money. Impulses that encourage us to snatch at profits, make rash trades and run losses can be detrimental to our wealth in the same way that running out into a stream of moving traffic could be very detrimental to our health. We could go so far as to say that there is no room for sentiment at all in trading, but if we said that we wouldn’t be entirely correct. Because while it’s true that we want to remove sentiment and emotion from our own trading, we should be quite happy to take advantage of other people’s sentiments.


Picking the right wave

Trading is effectively a three-way competition. First, you compete with yourself and your psyche, of course, you also compete with the market in the same way that a surfer competes with the ocean. That is reading the changes in the swell and the wind in order to pick to the right waves. However, you are also competing with other traders, because in forex for every winner there is a loser, and to make money, you need to try to ensure that other traders and not you are on the losing side, more often than not. To succeed, we need to follow a rules-based trading strategy that helps us back only the best trading opportunities that the market presents to us. We also need to try and develop an edge over our competition, that is other traders.

Of course, we don’t and can’t know who these other traders are, and even if we did it wouldn’t do us much good, because there are millions of them spread out across the globe trading away at any one time. However, the fact that there are so many competitors out there can work in our favour. Why? Because a crowd that big leaves a trail that we can follow and that can provide us with an edge.


Tracking the markets thinking

One of the methods that we can use to gauge what the rest of the market is thinking and doing is to look at what they are buying, selling and saying. That is measuring the sentiment towards the markets, and doing that in aggregate.


There are several ways in which we can do this. For example, we could study the weekly Commitment of Traders reports that are produced by the US CFTC which track changes in positioning in listed futures contracts (including FX majors) among key investor and trading groups. However, these reports are released three days in arrears, late on Friday afternoon in the USA. What’s more, they are not exactly user friendly in terms of their layout or the way that the data is presented or in the ease of interpretation (the CFTC is not known for its beautiful charts!).


Perhaps a more simplistic way to track trader sentiment is to look at what’s happening to the prices of safe-haven assets such as gold, the Japanese yen and Swiss franc and government bonds. If these instruments are rising in price, then that’s a sign of Risk-Off sentiment among traders.


If those safe-haven assets are strengthening when risk assets such as equities and Emerging Market currencies like the South African rand, Brazilian real and Turkish lira etc. are weakening, then you will know it’s risk-off. Of course, if we see risk assets appreciating while safe-havens are falling in price, that’s an indicator of Risk-On sentiment among market participants.


However, there are quite a few items to monitor the strategy outlined above. Since we are trying to gauge the aggregate sentiment of the crowd, it would be good if we had an indicator to gauge sentiment across a wide range of assets as well.


True we could try to use the VIX and other volatility indices, volatility is a measure of the rate and severity of price changes within an instrument or market. It tends to rise sharply as markets become fearful and trend lower when fear subsides and greed re-asserts itself. But once again, this would mean monitoring multiple items from different sources, to which we may have varying degrees of access.


A single gauge of sentiment?

Instead, what if we had one indicator that could tell us what others in the markets were thinking?


Fusion Markets has partnered up with some very talented engineers to simplify this even further.


Using cutting-edge artificial intelligence techniques known as Natural Language Processing (NLP), we can use machines to take in hundreds of thousands of data points across the web to gauge sentiment.


Are people talking about the Aussie dollar? What are they saying exactly? Are they positive or negative?


What about Gold? Is the crowd bullish or bearish?


To do this, yourself (e.g. scour hundreds of thousands of sources across the web) would be impossible. That’s why we always say there’s never been a more exciting time to be a trader (at least with Fusion anyway) and have these tools available that were previously only available to the world’s best hedge funds and asset managers.


We’ll leave it to you as to whether or not the crowd thinking it is highly bullish is a good signal to trade or a bad one and the strategy here (if you’ve read our views previously, you will know the answer!). Still, while it is not the holy grail as a single strategy, we believe this is a handy weapon to add to your arsenal to get an edge over others.


To start using our Sentiment tool now, create a Fusion account (it's free and there's no obligation to trade).

09/06/2020
Beginners
post image main
My Top Five Tools for Traders

Read Time: 5 Minutes


One of the questions I'm frequently asked is "How do you follow the markets? So, I thought it was time to compile a list of tools I use nearly daily that help me become a better trader.


These are for various experience levels. Oh, and they also happen to be completely free.


Here they are:


1. Babypips.com – Depending on your trading experience, their free forex school is second to none. It covers from beginners to advanced. In fact, these resources are so comprehensive that most brokers I’ve worked for make any new employees do the course from front to back!


2. Forexlive.com – handy website that I personally use and love! It has the most important (and live) news in the currency markets (hence the name). I remember during the Brexit vote that we were glued to their analysis of the markets.


3. Tradingview.com – If you love your charts and technical analysis (fun fact- something like 70% of traders do!) – then TradingView is for you. They have over 4,000,000 users, and the users are all very passionate! It’s not just for currencies either - you can pull up currencies, commodities, indices are more. While I’m personally not TOO much of a tech analysis guy, all my clients rave about TradingView.


4. John Authers' Commentary – To understand the forex markets, you need to understand the bigger macro picture. John is a must-read each day for me. I look forward to his email every day around the EU open. It covers stocks, bonds and what's catching his eye. If you read no other newsletter each day, make it this one.

5. Fusion Markets Economic Calendar– This is the only time we plug ourselves in our post. We used to have Myfxbook in there but we worked hard on finding a really slick calendar for you. Why a calendar? Knowing what big events are happening in the markets is critical. You don’t want to wake up and see the USD has made a 200 pip move and not known there’s been a US interest rate (FOMC) meeting. The Fusion economic calendar will be your friend. You can save the event to your calendar, view the results in real-time and can even see historical price movement and more. 

That’s it for now.

Why so short? The last thing you want is the “analysis paralysis” which comes from digesting 20+ resources. You will get overwhelmed and give up.

Believe me, it was hard for me to get it down to five, but these are my go-to resources, even if you asked me what the best paid subscription-based services are.

There is so much value in these resources, so please use them! Just because they’re free doesn’t mean it’s not great content. As I said, I use this every day myself (except Babypips – I like to think I’ve got the basics down pat) and I hope you do too.

01/09/2019
Newsletter
Top Articles
Popular Tags
Previous
Next
Ready to Start Trading?
Get started live or get a free demo